Working with Formulas and Data Tables in Excel
Examples of effective solutions for daily office tasks with spreadsheets. Creating reports, building charts and diagrams, performing various computational operations using formulas and functions. Information for self-learning, skill improvement, and increasing productivity for office workers.
How to Utilize MS Excel in the Office
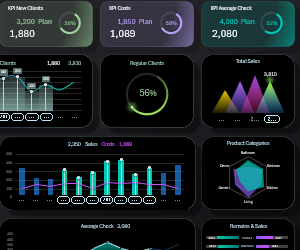 Download Dashboards in Excel to present reports with data visualization.
Interactive Excel dashboards for visual data analysis download for free. These visual reports are especially effective in developing quick strategies for influencing results and meeting goals on statistical metrics. The best examples of Excel visualization.
Download templates and dashboards with charts for Excel reports. How to create a template, dashboard, chart, or graph to make a visually appealing report for analysis in Excel? Choose examples of charts with graphs for interactive data visualization in Excel's smart tables and use them for quick decision-making. Download ready-made templates of dynamic charts for use in dashboards, reports, or presentations for free.
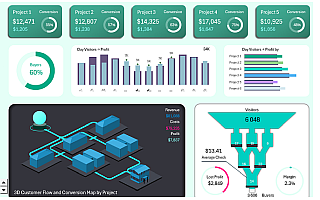 Download 3D dashboard for project management in Excel
This free dashboard template with a 3D project map will help you organize management tasks, track progress, and analyze results — all in one place.
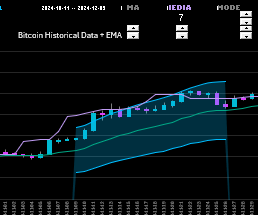 Exponential Moving Average Calculation in Excel Download
How to build a moving average price channel in Excel, use statistical functions like MEDIAN and MODE to develop safe futures trading strategies, and download example formulas to calculate EMA and SMA indicator algorithms.
 How to Create 3D Graphics for Game in Excel Using Formulas
Download a 3D game example in Excel and a 3D graphics generator template. Detailed instructions on how to create a 3D engine using Excel formulas without macros.
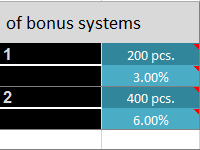 How to calculate discounts in Excel
An example of using a data table to find the best combinations when choosing a discount for a client under certain conditions. Matrix of numbers with conditional formatting. Template with sample analysis and what if, download free.
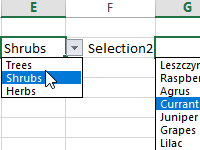 How to create a drop down menu in excel for database
Create a drop-down list for tables and ranges. We extend its capabilities: creating data substitution and dependent lists, selecting several elements at once. Simple solutions and macro codes.
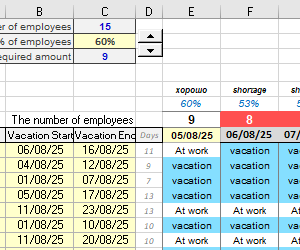 How to make a vacation schedule in Excel Download Example
How to automatically create a vacation schedule with certain conditions to control the number of employees at work? A convenient and visual schedule for planning vacations for company employees.
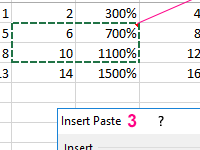 Copying of sheet data with standard Excel tools
The ways for copying ranges with shortcut keys & the context menu. The replication cell formats without values.
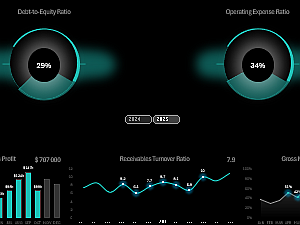 GETPIVOTDATA for working with pivot tables in Excel
Examples of using the GETPIVOTDATA function on dynamic charts controlled by pivot tables and data slices. Download a visualization template using the capabilities of the GETPIVOTDATA function.
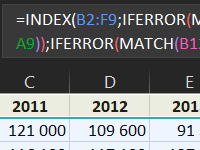 Formula INDEX and MATCH with Multiple Search Criteria in Excel
An example of searching and selecting values from a source table using the formula of the INDEX and SEARCH functions. How to create a formula to search using multiple criteria?
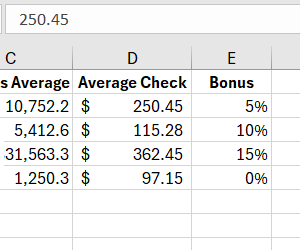 How to Fill Cells with Text and Numeric Values in Excel
Working with formats when filling cells of different types of data. Entering numeric and text values when filling out tables. Learn how to seamlessly enter text and numeric data, format cells for currency and percentages.
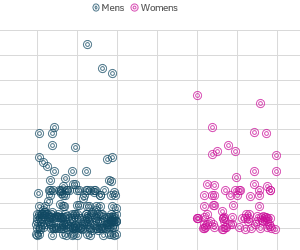 How to Create Jitter Scatter Chart for Statistics in Excel
An example of creating a scatter chart of jitter distributions in the statistical data view for visual analysis of the most popular values. Free Download MS Excel Chart Template.
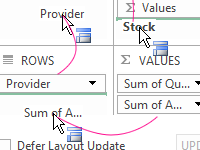 What is the use of Pivot Table and Pivot Chart in Excel
Working with pivot tables for filtering, sorting, grouping. Using formulas with the addition of calculated fields. Insert additional columns in the summary report.
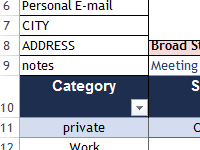 Download excel phone list template
Step by step creation of interactive telephone book template using the INDEX function and the MATCH. Free download database template contacts.
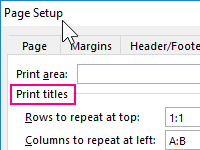 Printing of a table header on each page of the Excel sheet
The page setup options to print a table header on each sheet of paper for later convenient viewing of the data. There are pass-through strings and through sheets in the page parameters.
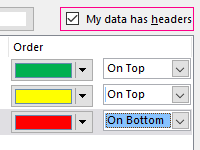 Sorting the data in Excel in rows and columns using formulas
How to sort values in several columns or rows, by cell color, in random order, automatically? Sorting is a convenient tool for implementing many tasks.
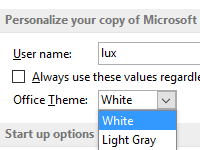 Changing the color scheme of the Excel interface Office Theme
The interface of the color scheme is configured in the same way for all programs that are included in the MS Office package.
