BCG Matrix: construction and analysis in Excel with example
The BCG matrix also called "growth - market share". It is a simple and intuitive tool for portfolio analysis. The availability and originality of the chart sectors names made it very popular among marketers and managers. Let’s consider the example of building a matrix in Excel.
Examples of using the BCG matrix
Using the matrix of the Boston Consulting Group (BCG) you can quickly and visually analyze the product groups and branches of the company. You can proceed company analysis based on their share in the relevant market segment and in the market growth rate. The using of the tool is based on two hypotheses:
- The leader in the market has a competitive advantage in production costs. Consequently, the leading company has the highest profitability in the segment.
- An enterprise needs to invest a lot in the development of its product to work effectively in a fast-growing market. The presence in the segment with a low growth rate allows the company to reduce this expense item.
With the help of the BCG matrix, it is possible to quickly identify the most promising and the "weakest" goods (branches, companies). You can make a decision on the basis of the received data: what assortment group (division) to develop, and which of them needs to be liquidated.
All the analyzed elements go into one of four quadrants after the analysis work:
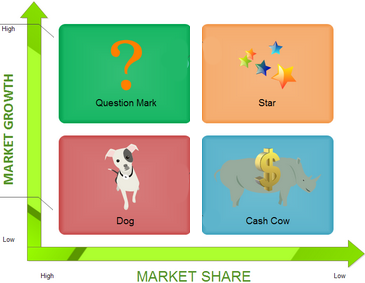
- "Problems". Products represented in fast-growing industries, but having a low market share., You need significant financial investments to strengthen their position in the market. The enterprise decides whether it has sufficient funds for the development of this assortment group or division if these directions fall into this quadrant. The product does not develop without cash injections.
- "Stars". Business directions and products are leaders in a fast-growing market. The task of the enterprise is to support and strengthen these products. The best resources should be allocated to them because it is a stable source of profit.
- "Moneybags". Goods with a relatively high market share in the slowly growing segment. They are the main generator of money and do not need high investment. It’s sales revenues should go to the development of "stars" or "wild cats".
- "Dead weight". A characteristic feature is the relatively low market share in the slowly growing segment. These directions do not make sense.
The BCG matrix: an example of construction and analysis in Excel
Let’s consider the construction of the BCG matrix on the example of an enterprise. Preparation:
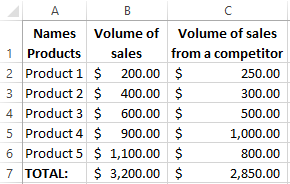
- Collect data and build the source table. A list of elements to be analyzed is made up at the first stage. It can be goods, assortment groups, company branches or enterprises. It is necessary to specify the volume of sales (profit) and similar data of a key competitor (or a number of competitors) for each indicator. The initial data is entered in the table. * The analyzed period can be different (month, quarter, half a year). But the closer this indicator to the year, the higher it’s objectivity (since seasonality does not affect the figures).
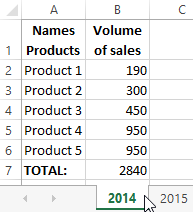
- Calculation of the growth market rate. It is necessary to calculate how much the sales volume has increased/decreased in comparison with the previous period. To do this we need data on the sales for the previous period.
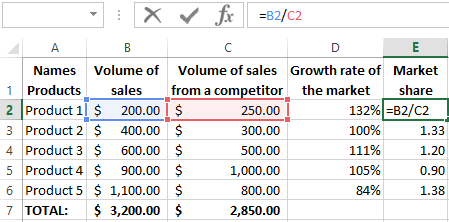
- The formula for calculating the growth market rate in Excel:
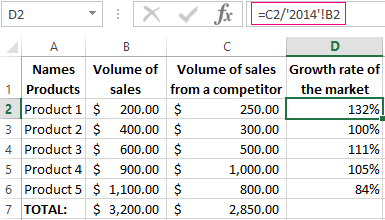 * The percentage format is set for cells in column D.
 - Calculation of the relative market share. For each of the analyzed products, you need to calculate the relative market share towards a similar product for a key competitor. To do this you have to divide the sales volume of the enterprise product by the sales volume of a similar product of the competitor.
Building the BCG matrix
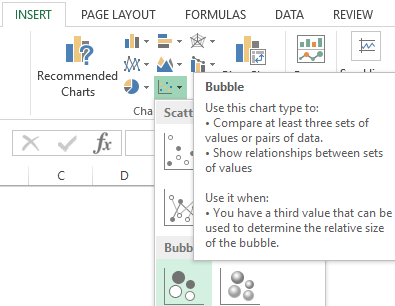
The best tool for these purposes is a bubble chart in Excel.
Add the construction area to the sheet using the "INSERT"-"Charts"-"Scatter"-"Bubble". We enter the data for each line as follows:
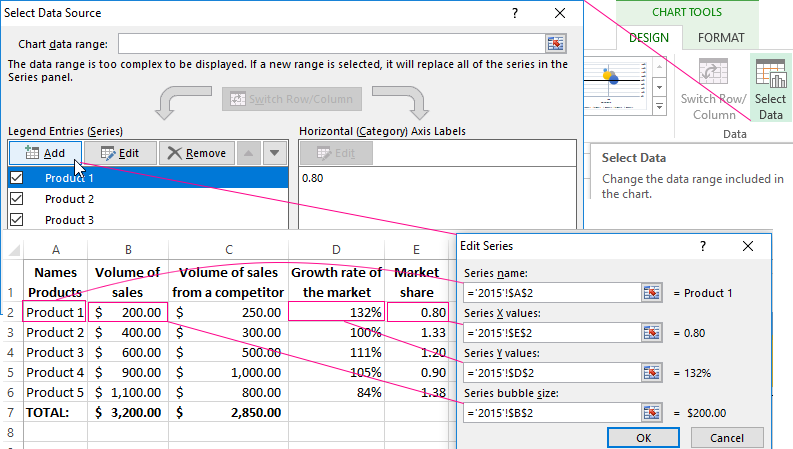
After select: "CHART TOOLS"-"DESIGN"-"Select Data"-"Add":
On the horizontal axis is the relative market share (set the logarithmic scale: "CHART TOOLS"-"FORMAT"-"Current Selection"-"Horizontal (Value) Axis"). On the vertical is the rate of market growth. The area of the diagram is divided into 4 identical quadrants:
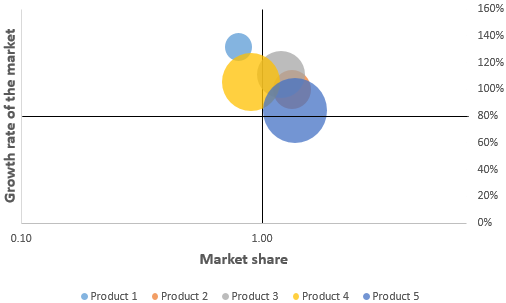
Central value for the growth market rate is 80%. For the relative market share is 1.00. We will distribute commodity categories taking into account these data:
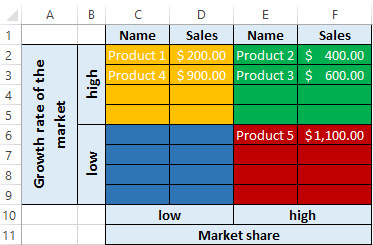
Conclusions:
- "Problems" - Item №1 and №4. Investments are needed to develop these goods. Scheme of development is next: creating a competitive advantage - distribution - support.
- "Stars" - Item №2 and №3. The company has such categories and this is a plus. At this stage, only support is needed.
- "Cash Cows" - Item №5. Brings a good profit which can be used to finance other products.
- "Deadweight" is not found.
It is desirable to preserve this state of affairs as long as possible. Subsequently, we need to analyze the prospects of "Difficult children" more deeply: is it possible to turn them into "Stars".
