Calculation of Business Efficiency Coefficient in Excel
Calculating enterprise efficiency coefficients is crucial for comparative analysis at the end of a period. There are several such coefficients in economics, and they can be effectively calculated using Excel.
Required Coefficients
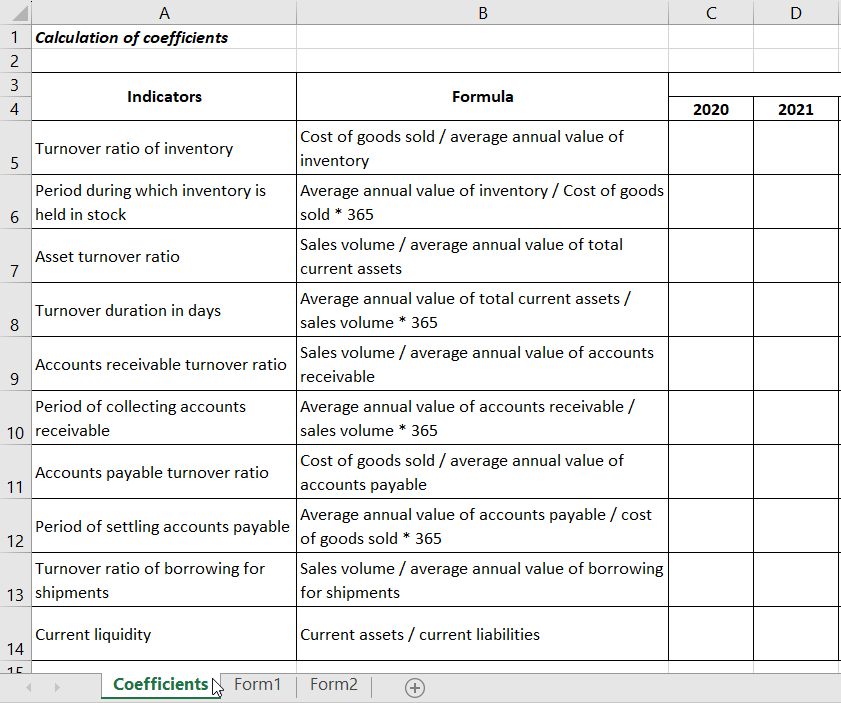
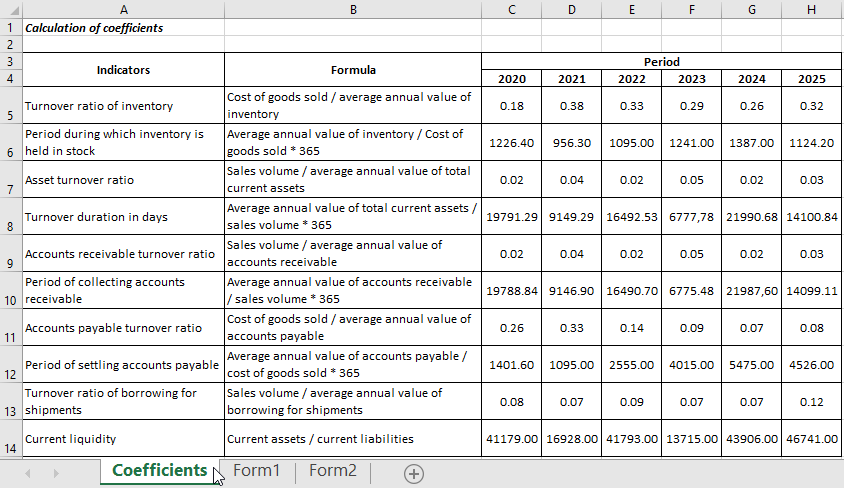
Before calculating the enterprise efficiency coefficient in Excel, let's prepare a table listing all the necessary indicators. Next to each, a formula is provided for convenience.
| Indicator | Formula |
| Turnover ratio of inventory | Cost of goods sold / average annual value of inventory |
| Period during which inventory is held in stock | Average annual value of inventory / Cost of goods sold * 365 |
| Asset turnover ratio | Sales volume / average annual value of total current assets |
| Turnover duration in days | Average annual value of total current assets / sales volume * 365 |
| Accounts receivable turnover ratio | Sales volume / average annual value of accounts receivable |
| Period of collecting accounts receivable | Average annual value of accounts receivable / sales volume * 365 |
| Accounts payable turnover ratio | Cost of goods sold / average annual value of accounts payable |
| Period of settling accounts payable | Average annual value of accounts payable / cost of goods sold * 365 |
| Turnover ratio of borrowing for shipments | Sales volume / average annual value of borrowing for shipments |
| Current liquidity | Current assets / current liabilities |
The table will be filled based on accounting data:
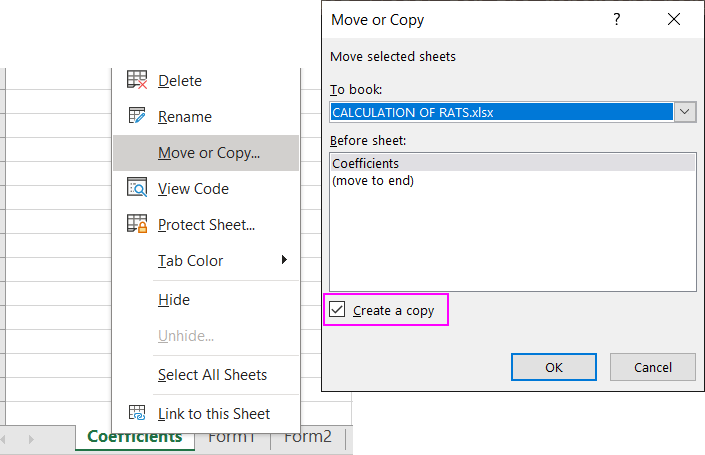
Accounting is typically conducted in separate documents. Therefore, for convenience, it's recommended to copy all reports into a single Excel workbook before setting up the formulas.
The file containing the table mentioned above is called "CALCULATION OF RATS". Open the file where the reports are stored. Right-click on the sheet and select MOVE OR COPY. A window will appear where you'll need to select the workbook to which you'll move the data sheet. Don't forget to check the box next to CREATE A COPY to ensure that the data doesn't get deleted from the original file.
Similarly, proceed with other sheets as needed.
Note! When copying sheets, the workbook to which the data is moved must be open.
Once all the data is in one workbook, you can start calculating the coefficients. But first, rename the report sheets for convenience. Let's call them FORM1 and FORM2.
Calculation of Efficiency Coefficients
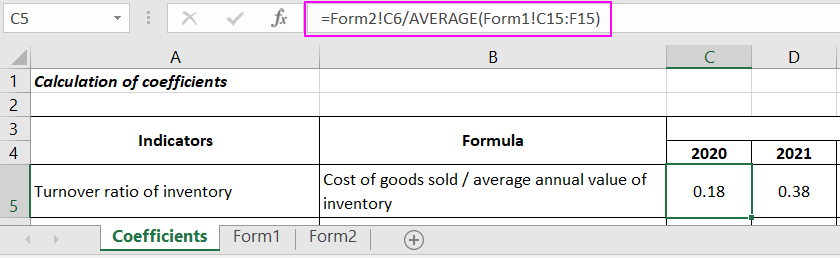
Now, input the formulas based on the textual definitions. The formulas are complex and reference cells from other sheets. The method of entering formulas in Excel depends on how the reports are structured. In our case, for example, to calculate the inventory turnover coefficient, the process is as follows:
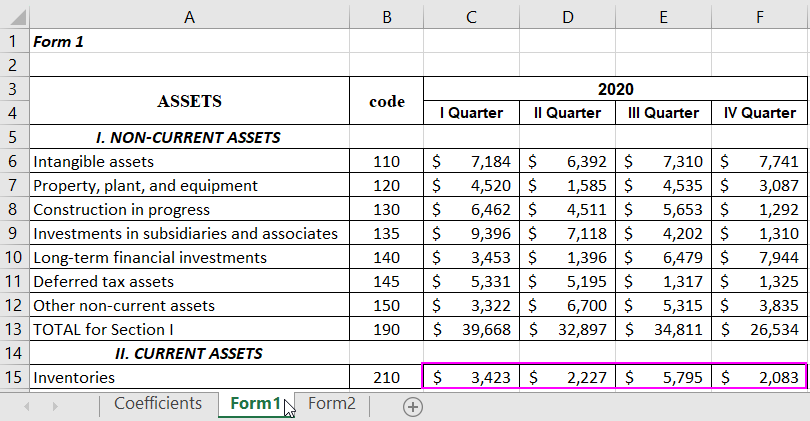
Considering that FORM1 looks like this:
And FORM2 appears as follows:
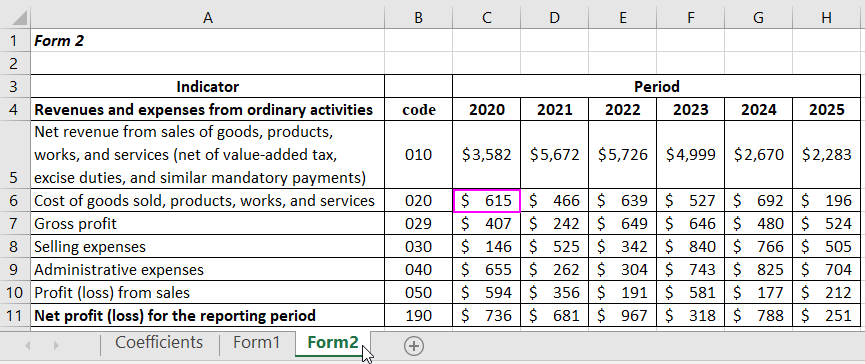
Note: Only the data necessary for the example is filled in our report forms. In reality, final numbers are calculated based on formulas depending on the filled preceding cells. Similarly, input formulas for other coefficients.
Note: To avoid entering lengthy formulas repeatedly and switching between sheets, simply follow the pattern and modify the alphabetical part of the formula (e.g., change K to P, J to O, etc.).
A summary table is produced with coefficients that vary based on values from FORM1 and FORM2.
 Download an example of the basic calculation of business efficiency coefficient in Excel
An economist can analyze the efficiency of a company's operations for each year based on the obtained data. The table can be extended to include 2015 and subsequent years. Formulas can be dragged to the right, and coefficients will be calculated automatically.
