Creating Financial Models in Excel for selling a business
When buying a business, a potential buyer evaluates the state of affairs at the enterprise. For analysis, a financial model is developed. Let's look at its components and the process of creating it.
Cash Flow Statement
One of the most crucial reporting forms that can determine business efficiency indicators and confirm financial stability. The statement reflects three types of activities: operational, investment, and financial. It can be filled out directly (manually) or indirectly. Let's consider the second method.
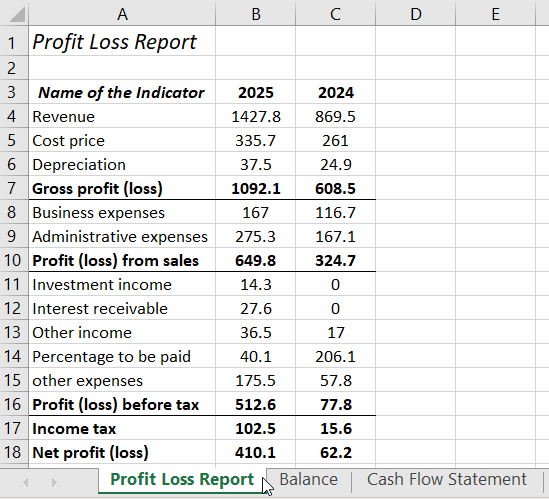
The company provided a profit and loss statement:
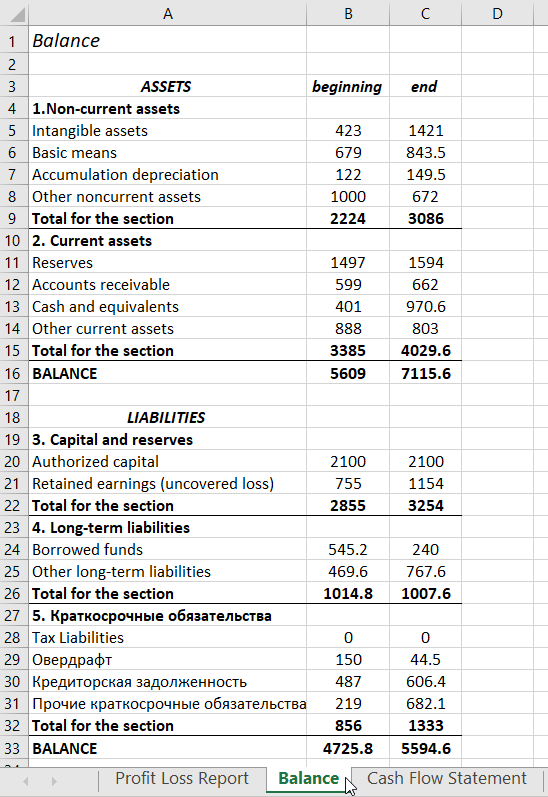
Balance Sheet:
* Figures and indicators are hypothetical, for example purposes.
Based on these two documents, we create a cash flow statement in Excel. We will use cell references with corresponding values, thus fully automating the process.
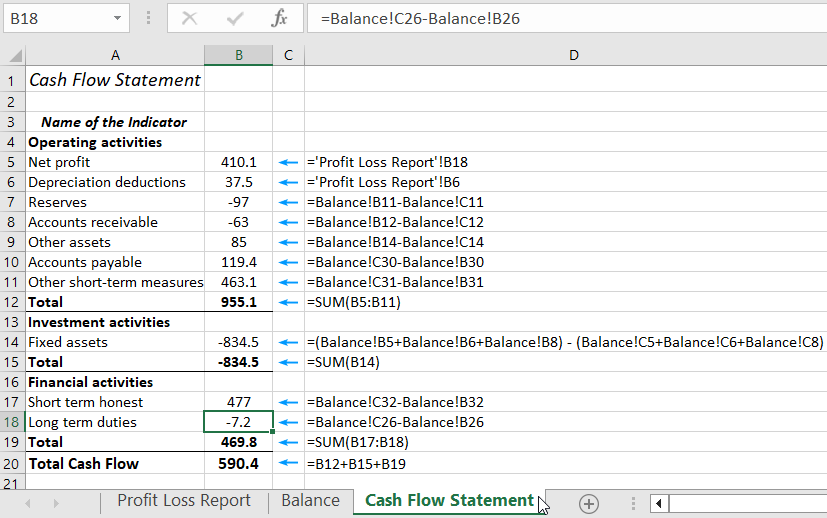
Formulas used:
- Net Profit (B5): ='Profit Loss Report'!B18 (reference to the corresponding cell in the profit and loss report).
- Depreciation (B6): ='Profit Loss Report'!B6.
- Inventories: =Balance!B11-Balance!C11.
- Accounts Receivable: =Balance!B12-Balance!C12.
- Other Assets: =Balance!B14-Balance!C14.
- Accounts Payable: =Balance!C30-Balance!B30.
- Other Short-term Liabilities: =Balance!C31-Balance!B31.
- Total "Operating Activities" =SUM(B5:B11).
- Non-current Assets, formula:
- Short-term Liabilities, formula: =Balance!C32-Balance!B32
- Long-term Liabilities, formula: =Balance!C26-Balance!B26
=(Balance!B5+Balance!B6+Balance!B8)-(Balance!C5+Balance!C6+Balance!C8)
To correctly indicate the sign (+/-) before a particular indicator value:
- For Asset Items – the value at the beginning of the period "minus" the amount at the end of the period;
- For Liability Items – the value at the end of the period "minus" the value at the beginning of the period.
To make report compilation easier using references to other documents, you can open them on one page. To do this, go to the "View" tab. Click the "New Window" button twice (we have two documents, not counting the current report). Then click "Arrange All" and set the window layout parameters:
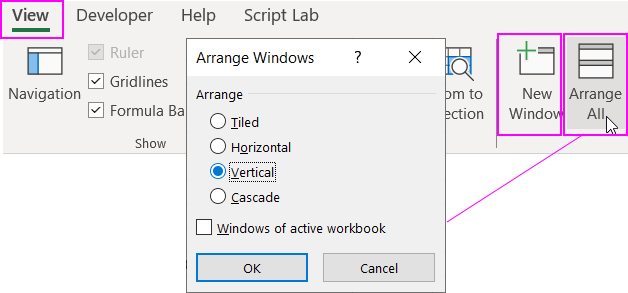
All three reports will appear in one window.
Based on the cash flow statement, profit and loss, and balance sheet, we will calculate financial indicators.
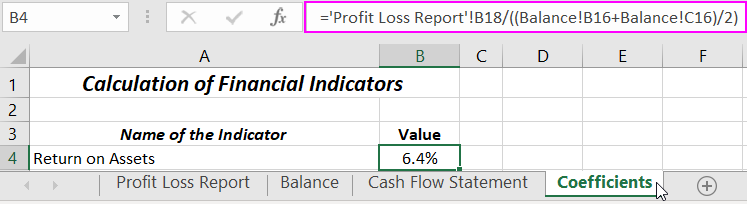
Algorithms for Calculating Key Financial Ratios
- Return on Assets. Reflects the profit size per unit of capital cost. Shows the efficiency of asset utilization. Formula: net profit / total assets. The first value is taken from the Profit and Loss Report. The second is from the Balance Sheet.
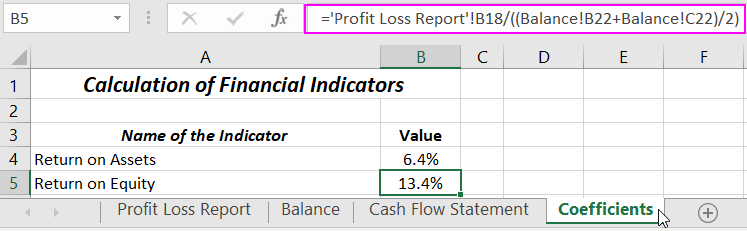
- Return on Equity. Shows the profit size per unit of equity. Allows determining capital efficiency. For a business owner, it answers, "how much will I earn from each dollar invested in the enterprise." Formula: net profit / average equity. This metric is compared with other investment options or bank deposit rates.
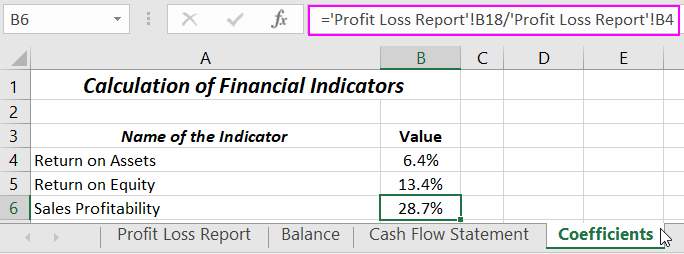
- Sales Profitability. Indicates the efficiency of current operations. The basis for calculation is the profit and loss statement. Formula: net profit / revenue.
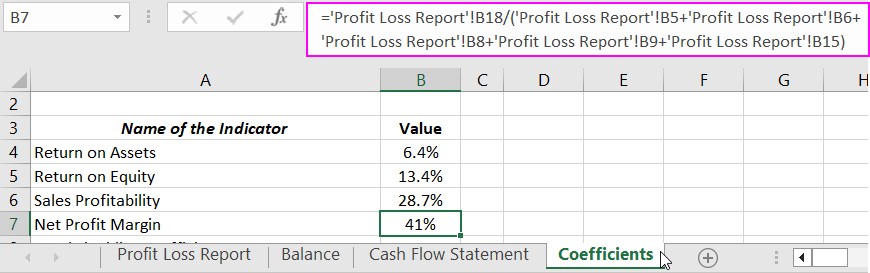
- Net Profit Margin. Formula: net profit / expenses. Based on the Profit and Loss Report.
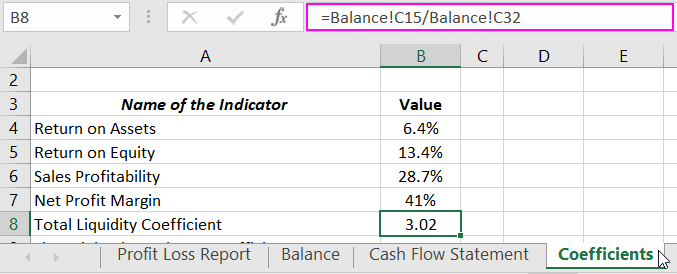
- Total Liquidity Coefficient. Relates current assets to short-term liabilities. Important for an investor (business buyer) as it shows the firm's ability to settle short-term obligations solely from current assets.
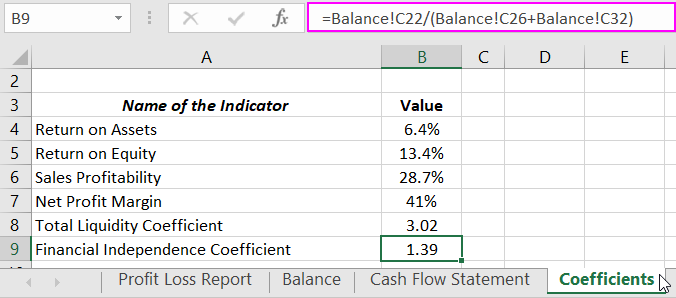
- Financial Independence Coefficient. Relates equity to total assets of the organization.
 Download the Excel Financial Model for Business Purchase Analysis
The algorithm for calculating financial indicators for creating a financial model in Excel when purchasing a business is illustrated in the images.
