Gordon Formula for Evaluating Future Stock Returns
The Gordon model, also known as the constant growth dividend discount model, is used to assess the value of equity and the profitability of common stocks. It considers the rate at which a company's dividend payments increase, influencing its valuation. Let's explore the formula in Excel through practical examples.
Gordon Model: Formula in Excel
The model's purpose is to evaluate the value of equity, its return, and the discount rate for an investment project. The Gordon formula is applied under specific conditions:
- Economic stability;
- Discount rate exceeding the rate of dividend growth;
- Stable growth in production and sales volume for the enterprise;
- The company has easy access to financial resources.
Formula for assessing the return on equity using the Gordon model – calculation example:
r = D1/P0 + g
- r – return on equity for the enterprise, discount rate;
- D1 – dividends in the next period;
- P0 – stock price at the current stage of company development;
- g – average rate of dividend growth.
To find the size of dividends in the next period, they need to be increased by the average growth rate. The formula becomes:
r = (D0 * (1 + g))/P0 + g
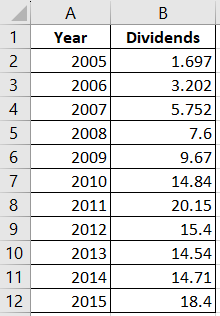
Evaluate the return on the shares of Mobile TeleSystems OJSC using the Gordon model. Create a table where the first column represents the year of dividend payments, and the second column represents the dividend payments in absolute terms.
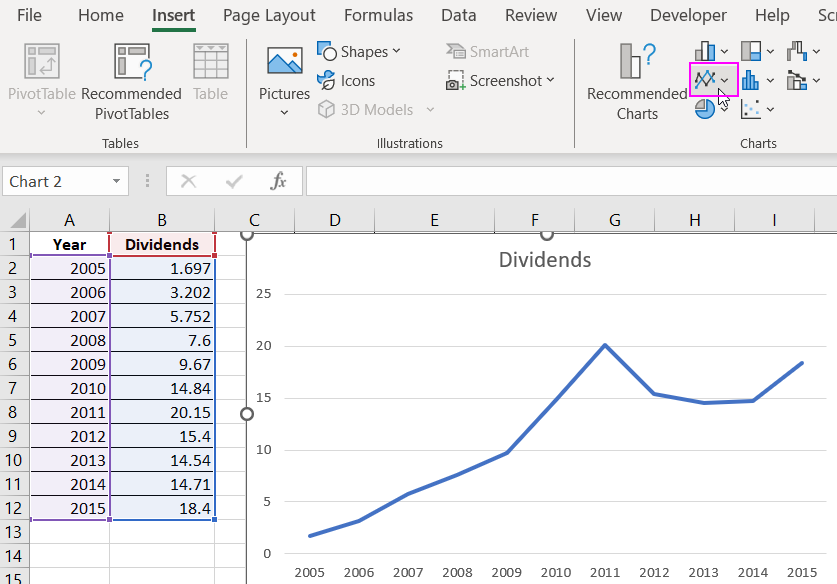
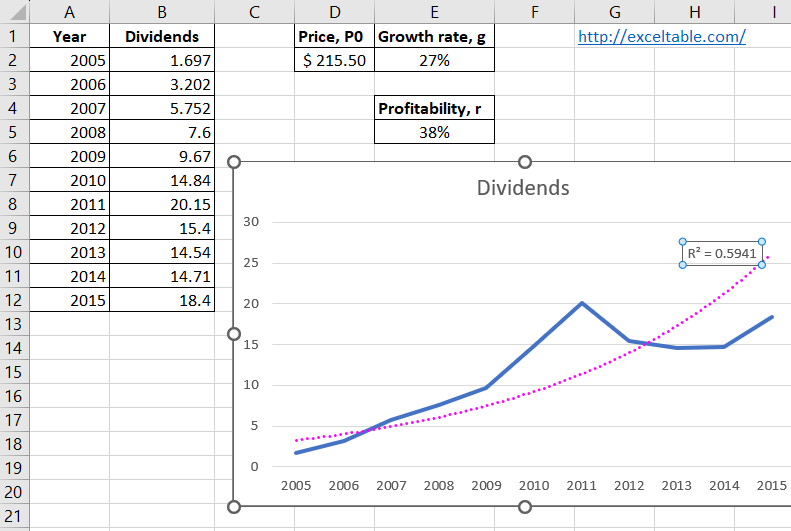
The Gordon formula "works" under certain conditions. Therefore, first, check whether dividend values follow an exponential distribution law. Plot the graph:
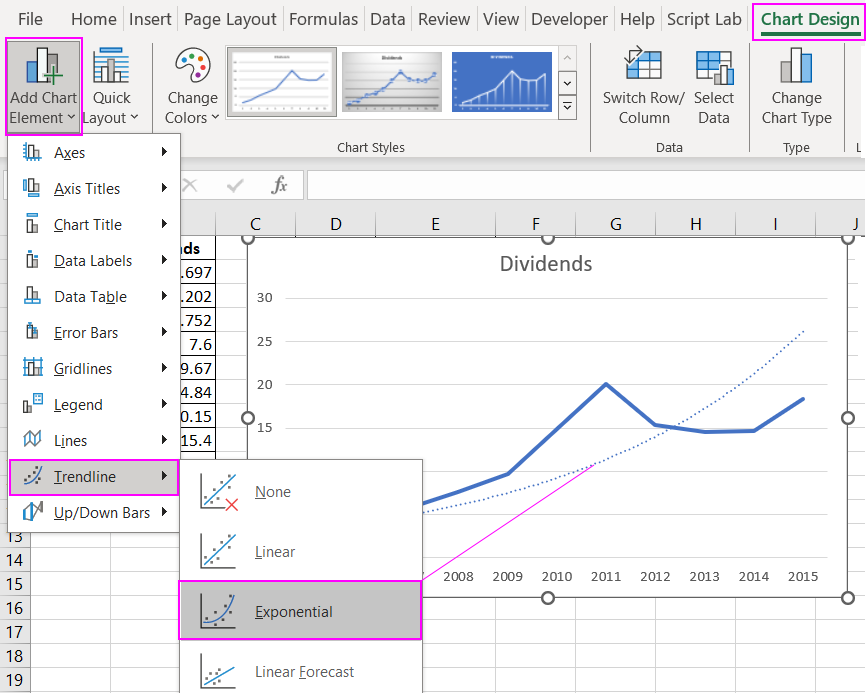
For verification, add a trendline with the accuracy of approximation. To do this:
- Click on the chart to make it active and choose the tool from the options in the main menu: "Charts Design" - "Chart Layouts" - "Add Chart Element" - "Trendline" - "Exponential":
- Right-click on the trendline on the chart. From the context menu, choose the "Format Trendline" option.
- In the additional window on the right, select the "Exponential" parameter and "Display R-squared value on chart."
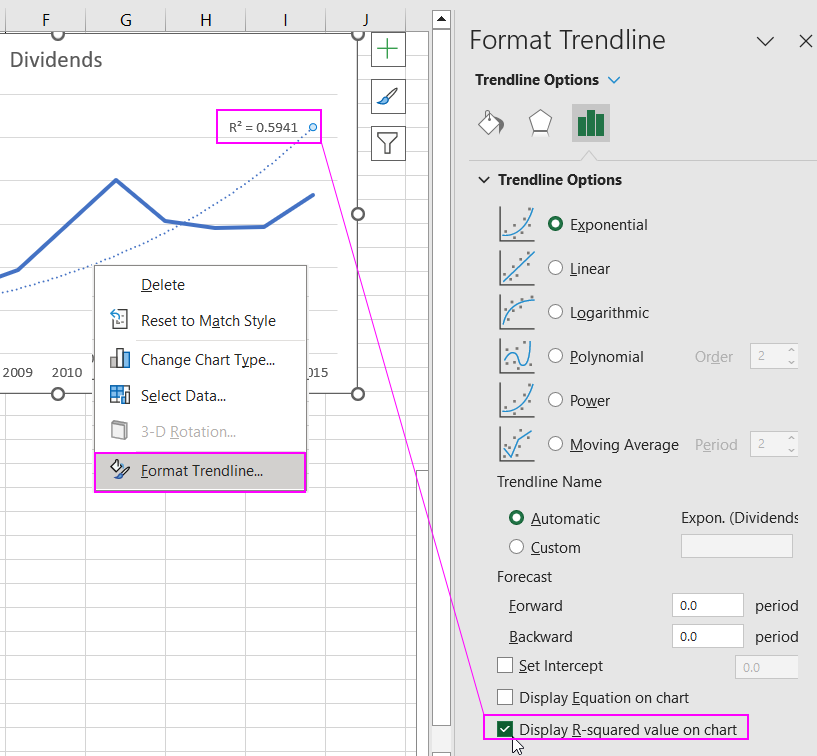
Now it's clear that the data in the "Dividends" range follows an exponential distribution law with 77% accuracy.
Next, find out the current value of Mobile TeleSystems OJSC's common stock. It is 215.50$.
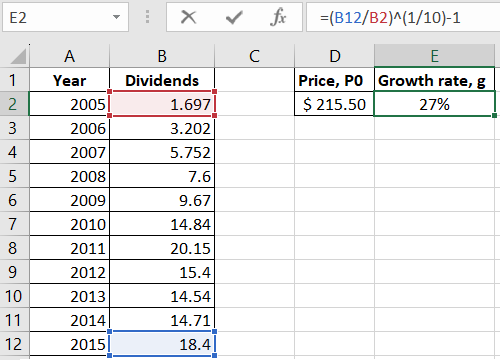
- Calculate the average annual growth rate of dividend payments. Use the compound interest formula since the price is changing. Apply the percentage format to the cell and enter the formula: =(B14/B4)^(1/10)-1. Where B14 is the latest dividend value, and B4 is the initial value in the analyzed range.
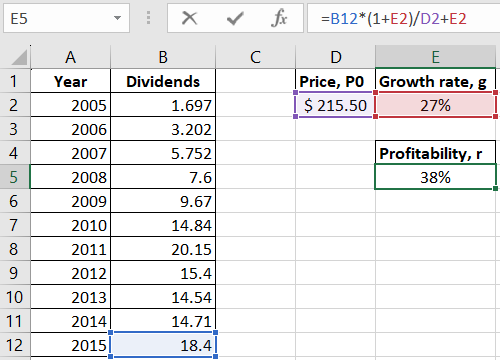
- Calculate the expected return on Mobile TeleSystems OJSC's common stock. Enter the formula: =B14*(1+E4)/D4+E4. Where B14 is the latest dividend value, E4 is the average annual growth rate, and D4 is the current value of common stock.
 Download Gordon Formula Calculation Template in Excel
Thus, the expected return on Mobile TeleSystems OJSC's common stock is 38%.
Business Valuation Method based on the Gordon Model in Excel
The value of an investment object at the beginning of the next period, according to the Gordon formula, is the sum of current and all future annual cash flows. The annual income is capitalized to form the business's value. This is crucial to consider when assessing a company's value.
The calculation of the capitalization rate according to the Gordon model in Excel is carried out using a simplified scheme:
FV = CF (1+n) / (DR – t)
The essence of the formula in evaluating the value of the business is almost the same as in the case of calculating the future return on stock. Different indicators are taken to determine the value of the business:
- FV – equity value;
- CF (1+n) – expected cash flows;
- DR – discount rate;
- t – rate of growth of cash flows in the residual period.
The difference in the denominator of the equation (DR – t) is called the capitalization rate. Sometimes the letter g is used to denote the long-term growth rate of cash flows.
How to calculate formula elements:
- t = price growth rate * production volume change rate;
- DR is assumed to be equal to the return on equity;
- 1/(DR – t) – income coefficient.
To evaluate a business using the Gordon model, find the product of incomes and the coefficient.
The model formula is used to assess investment objects and businesses in conditions of stable economic growth. The Russian market is characterized by volatility, so applying the model can distort results.
