How to Calculate Bankruptcy Forecast Ratio in Excel
The bankruptcy forecast ratio is one way to analyze a company's financial well-being. The earlier the reasons for deteriorating financial conditions are identified, the sooner appropriate management decisions will be made. At early stages, it's easier to prevent a company's insolvency, halt a collapse, or exit the business with minimal losses.
Definition of the Coefficient and Formula
Early detection of adverse trends in an organization's development is of paramount importance today. There are many methods for predicting bankruptcy. There's no single approach that can accurately determine an unfavorable outcome for a company. However, a combination of several methods can help make a reliable forecast.
All methods are conventionally grouped into two categories:
- "Quantitative" (based on the company's financial data; involve calculating specific coefficients).
- "Qualitative" (studying the conditions of bankrupt firms, comparing them with data from the analyzed company).
The bankruptcy forecast ratio is a "quantitative" method. It indicates the portion of net current assets contained in the balance sheet's assets.
The bankruptcy forecast coefficient shows a firm's ability to settle short-term obligations after selling inventories. If a company can settle its debts, it's solvent. Thus, bankruptcy is not imminent.
The classic formula for calculating the indicator is:
Kfb = (inventories with VAT + most liquid assets - short-term obligations) / balance currency (or asset balance).
The bankruptcy forecast ratio – formula based on the balance sheet:
Kfb = (code 1200 – code 1500) / code 1700 (or code 1600).
Calculation Example in Excel
The calculation involves the following data:
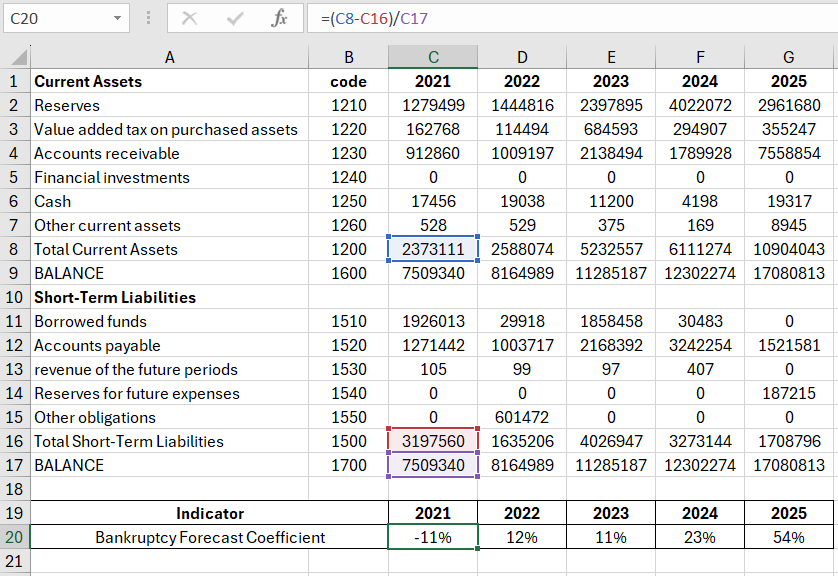
Analysis of Calculating the bankruptcy forecast ratio using references to the corresponding cells.
Interpreting the ratio value. A normative value is above 0. A negative value indicates an adverse situation in the company. The higher the value, the more stable the company's financial condition and the lower the financial risk.
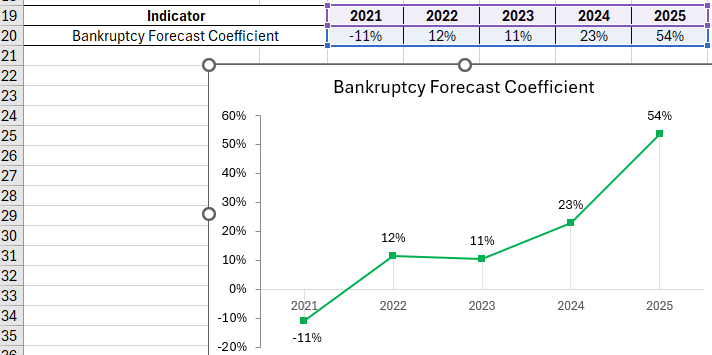
The bankruptcy forecast coefficient on a chart:
 Download an example of calculating Bankruptcy Forecast indicator in Excel
A significant increase in the indicator is noticeable in 2015: the company's well-being has stabilized, and bankruptcy is not imminent.
Biver's Model Analysis Algorithm
For comparison, let's consider one of the earliest "quantitative" methods for assessing a firm's financial well-being.
The author suggests using about thirty financial indicators. Typically, bankruptcy is forecasted based on 5 indicators:
- Biver's ratio ((net profit + depreciation) / (long-term + short-term liabilities));
- return on assets (net profit / balance currency; in percentages);
- financial leverage ratio ((long-term + short-term liabilities) / balance currency);
- asset coverage ratio by own current assets ((equity capital + non-current assets) / balance currency);
- current liquidity ratio (current assets / short-term liabilities).
Forecasts from the two methods used aligned. Biver's model for bankruptcy assessment also has its drawbacks (as do all "quantitative" methods). Hence, "qualitative" methods are also applied in practice. A comprehensive approach can minimize inaccuracies, explore optimal solutions, and yield truthful results.
