How to Calculate Financial Independence ratio in Excel
The financial autonomy coefficient (or independence) reflects the proportion of assets that can be covered by a company's equity. The remaining assets are covered by borrowed capital. This indicator is of interest to investors and banking organizations. The higher the value, the more independent the company.
Economic Meaning of the Indicator
The equity autonomy ratio is one of the indicators of a company's financial stability. Their values characterize the organization's long-term solvency.
The autonomy coefficient (concentration of equity, ownership of the enterprise) illustrates the degree of the organization's independence from creditors. It is determined as the ratio of equity to the total assets. In other words, it shows the share of equity capital in the aggregate assets, both owned and borrowed.
High values of the indicator indicate financial stability, while low values indicate significant dependence on creditors.
The equity ratio is used by financial analysts, arbitrators, credit organizations, and investors.
Financial Autonomy ratio and Balance Formula
The general formula of the indicator:
FA = Equity and reserves / Assets.
The calculation considers the sum of all company assets (highly liquid, quick, slow, and hard-to-sell).
The formula based on the balance sheet data:
FA = code 1300 / code 1700.
In essence, figures from the balance sheet liabilities are needed.
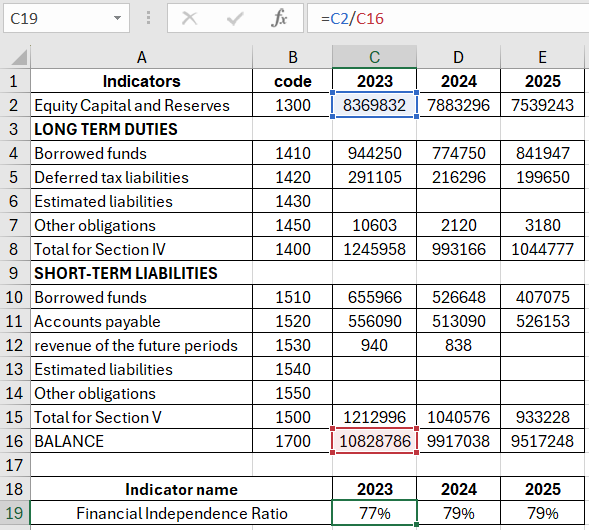
Calculation of the financial independence coefficient:
 Download an example of calculating the Financial Independence ratio in Excel
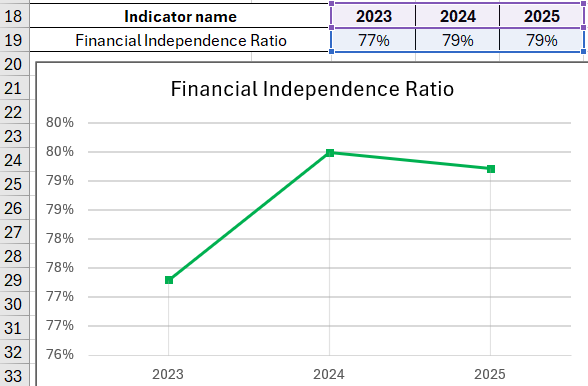
The indicator has not significantly changed over three analyzed periods, indicating the firm's stable financial condition. To draw conclusions about the company's independence from borrowed funds, the standard value must be known.
Financial Autonomy ratio: Normative Value
The accepted normative limitation for companies is >0.5. The higher the indicator, the more stable the organization's financial condition is considered. The optimal value is 0.6-0.7.
If the coefficient approaches unity, the company's growth rates may be constrained. The enterprise intentionally avoids attracting borrowed capital, thus missing out on an additional funding source. After all, borrowed funds can indeed increase revenues. On the other hand, if the market situation worsens, the company's financial position will deteriorate.
The values of the ratio for the studied company (see above) do not drop below 0.75. What conclusions can be drawn:
- The company is financially stable.
- If all creditors demand repayment simultaneously, the firm will be able to settle its debts.
The standard value of the indicator is generalized. The financial independence coefficient of a specific company should be compared with the same indicator of enterprises within the same industry. Such an approach will help determine the exact position of one's firm among competitors.
Conclusions:
- The financial autonomy ratio shows the share of the company's ownership in the total assets.
- It is calculated as the ratio of equity to the company's total resources.
- The accepted norm is greater than 0.5.
- If less than 0.5, it indicates the possibility of acquiring assets with borrowed funds, reducing the company's financial stability.
- High values indicate financial stability (independence from attracted capital) and the ability to quickly repay all debt obligations.
