How to Calculate Overall Capital Turnover Ratio in Excel
The overall capital turnover ratio is one of the indicators of a company's business activity. It reflects the speed at which all of the company's assets are turned over. In other words, it indicates how many times during the analyzed period a complete cycle occurs (from producing a product or service to its sale and profit realization).
This indicator represents the efficiency of a firm's asset utilization, showing how much money each asset brings in from sales.
Analysis of Turnover for Determining Business Activity
Business activity reflects the effectiveness of a company's operations relative to the amount of investment or consumption of resources during production. The indicator expresses the dynamic development of the enterprise, its achievement of set goals, and the speed of capital turnover.
Turnover depends on:
- The annual turnover amount.
- The size of expenses (the higher the turnover rate, the lower the expenses per turnover).
- The speed of turnover at each stage (acceleration at one stage leads to an increase in turnover speed at other stages).
The higher the turnover rate, the less the company needs to attract additional funds or the more products it can produce. As assets turn over faster, working capital is released, less raw materials and fuel are needed, leading to the release of financial resources invested in these inventories.
Analyzing business activity involves examining various ratios, with one of the primary ones being the overall capital turnover ratio (assets).
Overall Capital Turnover Ratio (Asset Turnover): Formula
The standard analysis period is usually a year. This ratio shows how many times a company's assets are turned over. The turnover speed, or the rate at which assets are converted into cash, directly affects the organization's solvency.
The formula for the overall capital turnover ratio:
Revenue / Average Assets.
The formula for the overall capital turnover ratio based on the balance sheet is:
code 2110 / (0.5 * (code 1600np + code 1600kp)),
where code 2110 comes from form 2 (financial results report), and code 1600 comes from form 1 (balance sheet).
We will calculate the capital utilization efficiency using Excel tools. Data:
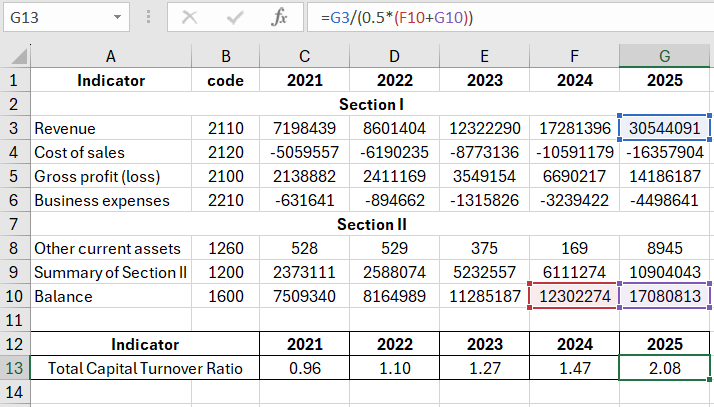
We've incorporated references to cells in the corresponding documents into the formula.
Indicator Norm
We will analyze the overall capital turnover ratio. There's no established standard value for this indicator. Often, the obtained figures are compared with industry benchmarks. For instance, turnover will be lower in capital-intensive sectors than in trade.
The higher the ratio, the faster the capital turns over, and the more money the enterprise earns per dollar of assets. For analysts, it's crucial to monitor this indicator's dynamics over several periods.
Accelerated capital turnover reflects:
- Increased production and technical potential.
- Profit growth (calculated per asset unit).
- High asset utilization efficiency.
An increase in the ratio can be artificial due to leased fixed assets.
A decrease in the ratio indicates a decline in sales volume or an increase in financial investments in used assets.
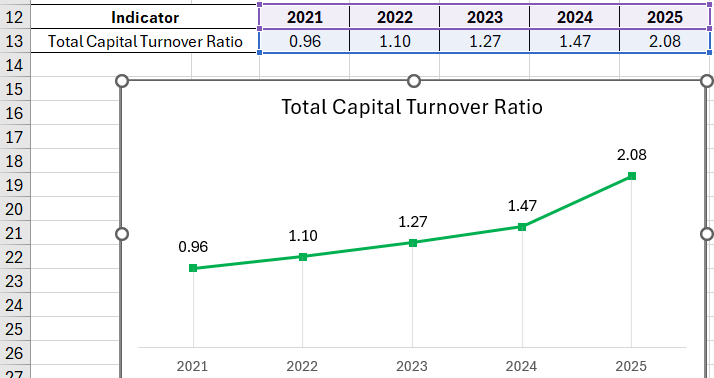
Let's return to the example and visualize it on a Chart:
 Download an example of calculating Overall Capital Turnover Ratio in Excel
A consistently increasing turnover ratio indicates effective asset utilization by the company. The release of funds (due to accelerated turnover) allows the organization to improve its material and technical base, possibly launch a new product, or open a new sales direction.
