How to Calculate Profitability Ratio of Sales in Excel
The level of economic efficiency of a financial, labor, or material resource is characterized by a relative indicator known as profitability. It is expressed as a percentage and widely used to evaluate the performance of a commercial enterprise. There are many types of this concept. Each of them is a ratio of profit to the asset or resource under consideration.
Understanding the Concept of Profitability Ratio
The profitability ratio of sales indicates the business activity of a company and reflects its efficiency. Evaluating this metric helps determine how much money from product sales represents the company's profit. It's not about how much product was sold, but how much net profit the company earned. The indicator can also help find the proportion of cost in sales.
The profitability ratio of sales is usually analyzed dynamically. Increases or decreases in this ratio indicate various economic phenomena.
If profitability is increasing:
- Revenue increases faster than costs (either sales volumes have increased, or the product range has changed).
- Costs decrease faster than revenue (the company either raised product prices or altered the product mix).
- Revenue increases while costs decrease (prices increased, product range changed, or cost norms altered).
The first two situations are definitely favorable for the company. Further analysis is directed at assessing the sustainability of such a position.
The second situation is not necessarily favorable for the company. Although the profitability indicator has technically improved (revenue has decreased), pricing and product range analysis are necessary for decision-making.
If profitability is decreasing:
- Costs are increasing faster than revenue (due to inflation, price reductions, increased cost norms, or product range changes).
- Revenue decreases faster than costs (sales have declined).
- Revenue decreases while costs increase (cost norms increased, prices decreased, or product range changed).
The first trend is definitely unfavorable. A thorough analysis of the causes is required to rectify the situation. The second situation indicates the company's desire to reduce its market influence. If the third trend is detected, a review of pricing, product range, and cost control systems is necessary.
How to Calculate Sales Profitability in Excel
The international abbreviation for this indicator is ROS. The profitability ratio of sales is always calculated based on profit from sales.
The traditional formula:
ROS = (Profit/Sales) * 100%.
In specific situations, calculations might require determining the share of gross, balance, or other profit in sales.
The formula for gross profitability of sales (margin):
(Gross Profit / Revenue from Sales) * 100%.
This indicator shows the level of "raw" money (before deductions) earned by the company from product sales. Elements of the formula are taken in monetary terms. Gross profit and revenue can be found in the financial results report.
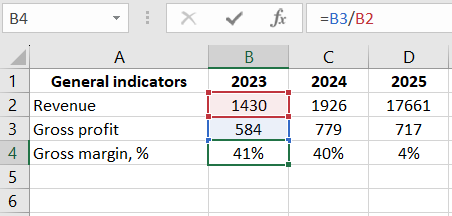
Information for calculation:

In the cells for calculating gross profitability, set the percentage format. Enter the formula:

The profitability indicator based on gross profit over three years is relatively stable. This suggests that the company carefully monitors pricing and product assortment.
Profitability of sales based on operating profit (EBIT):
(Operating Profit / Revenue from Sales) * 100%.
This indicator represents how much operating profit corresponds to one dollar of revenue.
How to calculate the sales profitability ratio based on the balance (Form 2 formula):
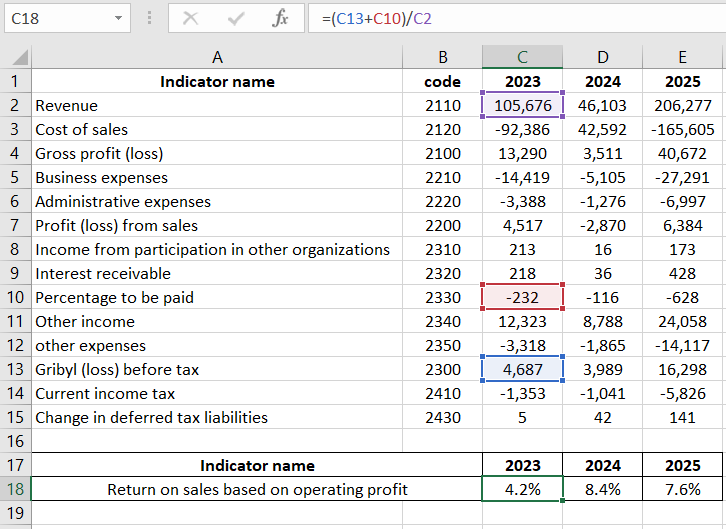
((Page 2300 + Page 2330) / Page 2110) * 100%.
Calculate profitability based on operating profit by substituting the necessary cell references into the formula:

The formula for sales profitability based on net profit:
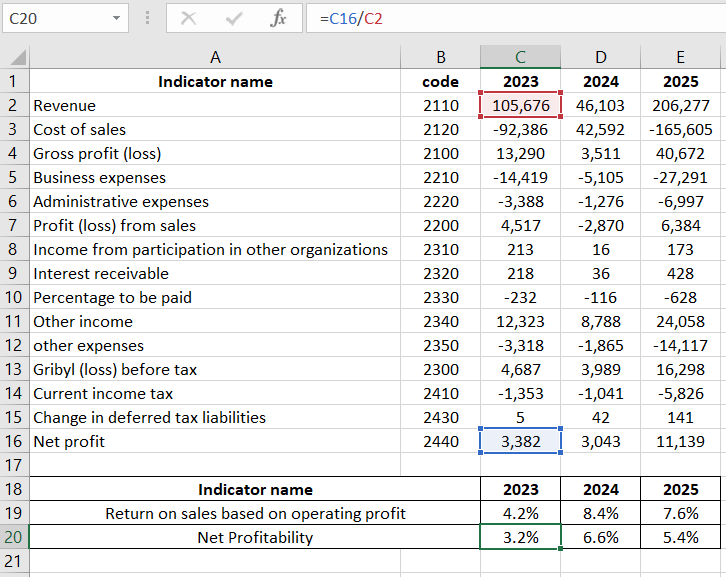
(Net Profit / Revenue) * 100%.
Net profitability shows how much net profit corresponds to one dollar of revenue. Both indicators are taken from the financial results report.

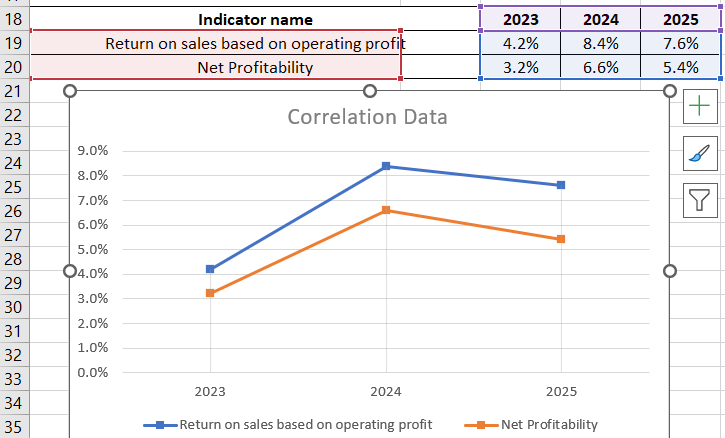
Show the sales profitability ratio on a chart:

 Download an example of calculating the Sales Profitability Ratio in Excel
In 2015, the indicator significantly decreased, indicating an unfavorable trend. Further analysis of the product assortment, pricing, and cost control system is required.
A value above zero is considered normal. A more specific range depends on the industry. Each company compares its sales profitability ratio to the industry standard. It's beneficial if the calculated indicator is close to the inflation rate.
