How to Calculate the Liquidity Coverage Ratio in Excel
Liquidity refers to the ease of realization, the conversion of assets into financial resources to settle current monetary obligations. The ability of a company to cover short-term debt with current assets is determined by liquidity ratios. Each of the indicators compares the size of a company's current liabilities and the current assets intended to cover these obligations.
Current Liquidity Coverage Ratio: Formula
The current liquidity ratio (overall coverage ratio, turnover indicator, coverage of liabilities, debt) characterizes a company's ability to cover short-term debt with "liquid" assets. This financial indicator is the ratio of current assets to current liabilities. Analytical figures are taken from the balance sheet.
A higher value indicates greater solvency. When calculating the debt coverage ratio, it is considered that selling all assets immediately is not possible. The derived indicator is of interest to management and investors.
Calculation formula:
CLR = Working Capital / Short-Term Liabilities.
Based on the balance sheet:
CLR = (code 1200 + code 1170) / (code 1500 – code 1530 – code 1540).
Values for the calculation of the ratio:
| Indicator | code |
| Non-current Assets | |
| Profitable investments in material assets | 1160 |
| Financial investments | 1170 |
| Deferred tax assets | 1180 |
| Other noncurrent assets | 1190 |
| Total Non-current Assets | 1100 |
| Current Assets | |
| Reserves | 1210 |
| Value added tax on purchased assets | 1220 |
| Accounts receivable | 1230 |
| Financial investments | 1240 |
| Cash | 1250 |
| Other current assets | 1260 |
| Total Current Assets | 1200 |
| BALANCE | 1600 |
| Short-Term Liabilities | |
| Borrowed funds | 1510 |
| Accounts payable | 1520 |
| revenue of the future periods | 1530 |
| Reserves for future expenses | 1540 |
| Other obligations | 1550 |
| Total Short-Term Liabilities | 1500 |
| BALANCE | 1700 |
Formula for calculation in Excel:
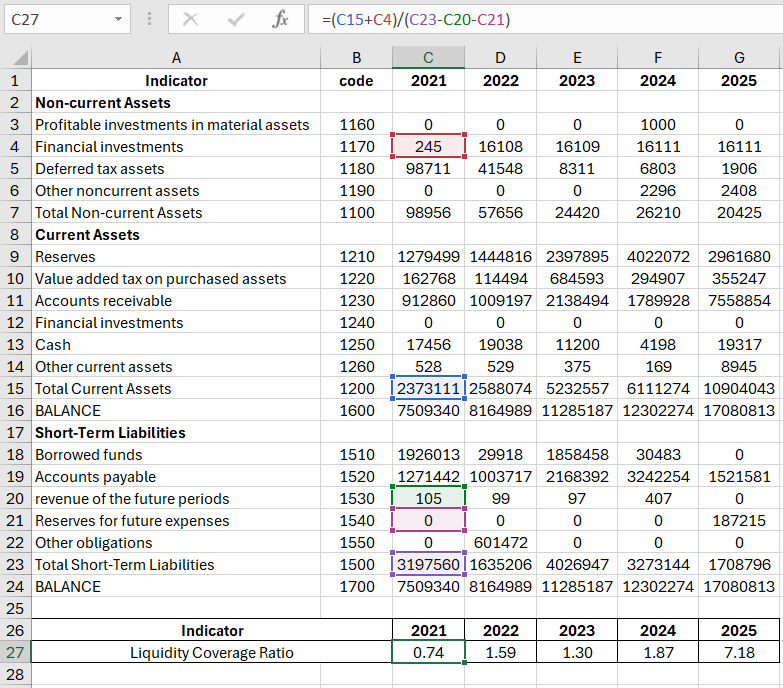
The norm of the indicator is within 1.5-2.5 (specific figures depend on the industry). In 2011, the current liquidity ratio was less than 1, indicating high financial risk. During this period, the enterprise might have faced difficulties in paying its current bills:
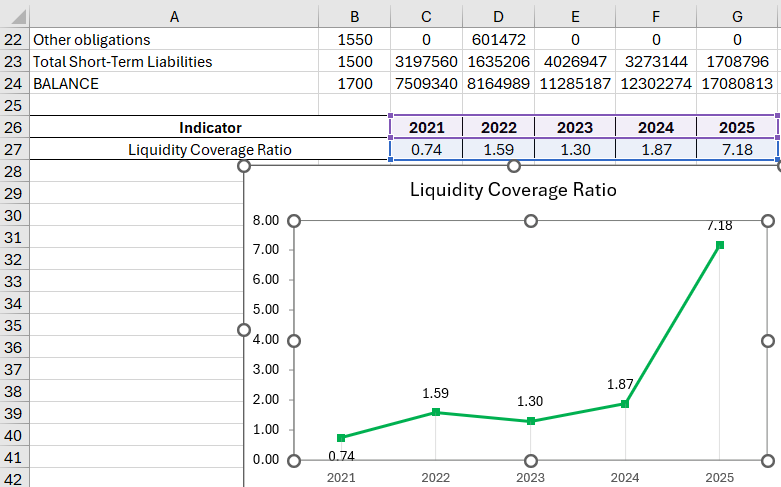
After 2012, the situation stabilized. The value ranged from 1.3 to 1.9. A sharp increase in the ratio in 2015 and its significant exceeding of the upper limit of the norm may indicate insufficient use of current assets and an irrational capital structure.
The debt coverage ratio does not always provide an accurate picture of the company's real condition. If a company has small manufacturing inventories and bills are quickly and easily covered by cash, it can operate calmly even with a low indicator value. At the same time, companies with large inventories and product sales on credit face challenges with a sufficient coefficient value.
For banks, suppliers, and shareholders, the quick liquidity ratio is of greater interest. Companies might find themselves in situations where immediate repayment of short-term debt is needed. All money, securities, and other sources that can quickly be converted into cash will be required.
Calculation of the Intermediate Liquidity Indicator
The liquidity ratio (intermediate coverage ratio, quick liquidity indicator) shows the portion of short-term liabilities that can be settled in a critical situation. Only highly liquid assets (cash, easily marketable securities, accounts receivable) are considered in the calculation. Inventories are not considered, as their liquidation value is equated to zero due to potential significant losses during forced sales.
The critical liquidity ratio is the quotient of highly liquid current assets divided by current liabilities. The figures for the calculation are taken from the balance sheet.
Formula:
Critical Liquidity Ratio = (Financial Resources + Short-term Monetary Investments + Short-term Accounts Receivable) / Current Liabilities.
Calculation based on the balance sheet:
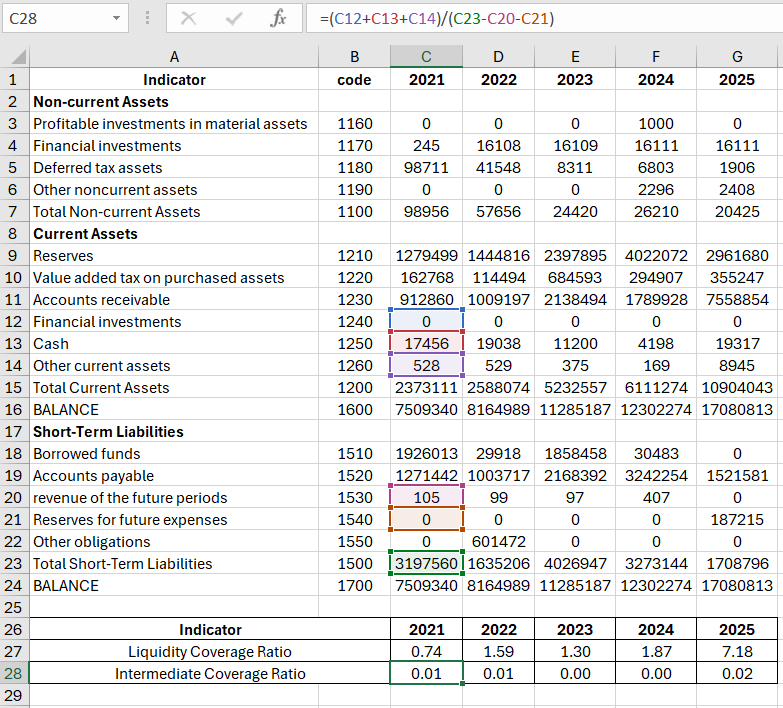
CLR = (code 1240 + code 1250 + code 1260) / (code 1500 – code 1530 – code 1540).
The numerator values for 2021 are - (based on the balance sheet): (C12+C13+C14) = 17984
The denominator for the quick liquidity calculation is current liabilities (similar to the current liquidity calculation; see above): (C23-C20-C21) = 3197455
We'll calculate the intermediate coverage ratio using balance sheet references:
 Download an example of calculating the Current and Intermediate Liquidity Coverage Ratios
A range of 0.7-1 is considered normal for the indicator. For the company under consideration, the coefficient value is close to zero. This means that the company might be denied credit or be offered credit at a higher interest rate. There is also a high risk of losing potential investors.
