How to do Multidimensional Cluster Analysis in Excel
Cluster analysis groups clusters and variables (objects) that are similar to each other. In other words, it classifies objects. Often, when solving economic tasks with a large amount of data, multidimensionality of description is required. Cluster analysis is one of the simple methods of multidimensional analysis.
Cluster analysis is a quantitative tool for studying socio-economic processes, where multiple characteristics are necessary for description. It allows segmenting the sample into several groups based on the feature under study, analyzing groups (how variables are grouped), and grouping objects (how objects are grouped). This method is used for market segmentation, analyzing agricultural sectors for performance comparison, forecasting market trends for specific products, etc.
How to Perform Cluster Analysis in Excel: Scope and Guide
Essentially, cluster analysis is a set of tools for classifying multidimensional objects. The method involves determining the distance between variables (deltas) and then grouping observations (clusters).
Clustering techniques are applied in various fields. The main goal is to divide a multidimensional set of examined values (objects, variables, features) into homogeneous groups or clusters. This means that data is classified and structured.
The primary question for researchers using cluster analysis is how to organize a multidimensional sample into clear structures.
Examples of using cluster analysis include:
- In biology – for species classification on Earth.
- In medicine – for classifying diseases by symptom groups and treatment methods.
- In psychology – for determining behavior types in specific situations.
- In economic analysis – when studying and forecasting economic downturns, analyzing market trends.
- In various marketing researches.
When there's a need to transform mountains of information into useful groups for further study, cluster analysis is used.
Advantages of the method:
- Allows breaking down a multidimensional series based on a set of parameters;
- Data of almost any nature can be considered (no restrictions on the type of objects studied);
- Can handle significant volumes of information, compressing them effectively for clarity;
- Can be applied cyclically, conducted until the desired result is achieved; significant changes in the research direction can occur after each cycle.
Delta-cluster analysis also has its drawbacks:
- The composition and number of clusters depend on the specified criteria;
- When transforming the original dataset into compact groups, the initial information can be distorted, and individual objects may lose their uniqueness;
- The absence of certain cluster values in the analyzed set is often ignored.
How to Perform Cluster Analysis in Excel
Let's take an example of six observation objects. Each has two defining parameters.
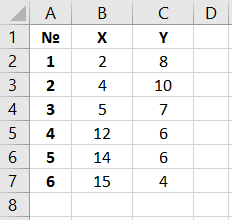
The Euclidean distance is chosen as the distance measure between objects. The calculation formula is:
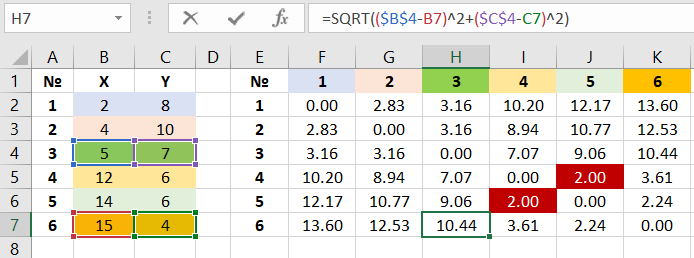
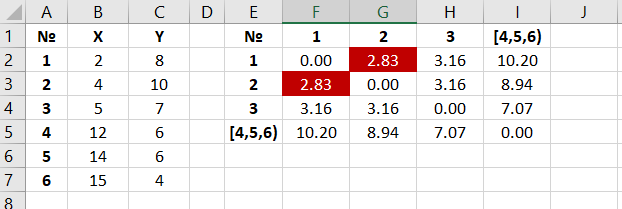
The calculated data is placed in a distance matrix.
Objects 4 and 5 are the closest to each other. Thus, they can be grouped together, retaining the lowest value when forming a new matrix.
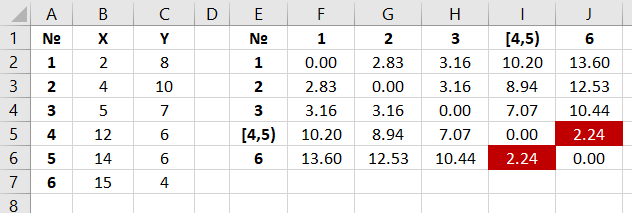
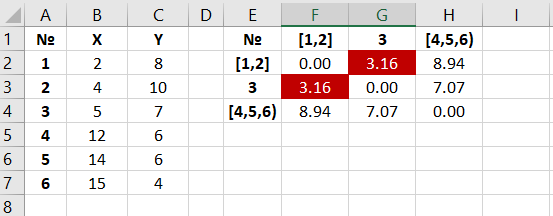
From the new matrix, objects [4, 5] and 6 can be grouped into a single cluster (as they are closest in value). The lowest value is retained, forming a new matrix:
Objects 1 and 2 can be grouped into one cluster (being the closest among the available). The new distance matrix is formed by selecting the lowest value. As a result, three clusters are obtained:
The closest objects are 1, 2, and 3. They are combined.
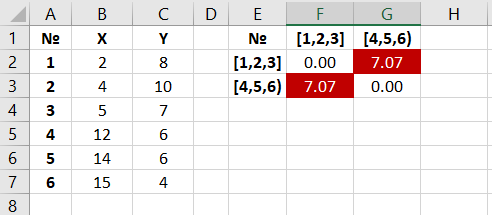
We performed cluster analysis using the "nearest neighbor" method. As a result, two clusters were obtained, with a distance of 7.07 between them.
 Download an example of performing cluster analysis in Excel
Cluster analysis is of immense importance in economic analysis. The tool allows extracting periods from vast datasets where values of corresponding parameters are maximally similar, and dynamics are most alike. This method is highly suitable for studying commodity and overall economic trends. Additionally, cluster analysis is effectively used in algorithms when creating indicators for analyzing stock market trends.
