Examples of data analysis in Excel
Examples and effective solutions for complex tasks in the creation of reports, analysis and the formation of documents. Application of formulas, functions and analytical tools in the process of working with spreadsheets.Analyzes and calculations with formulas and charts
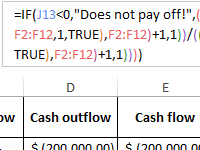
 Download template of the investment project analysis in Excel.
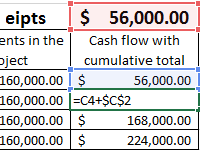
The financial model of the investment project is a convenient tool for all users. In the tables you can evaluate the formulas used, compare the results. Scheme of the method for calculating the return on investment.
 Calculation of the moving average in Excel and forecasting.
For calculation, the AVERAGE function and the Moving Average of the Data Analysis Package add-in are used. Procedure for using the program's capabilities and making forecasts.
 Solving equations in Excel using the Cramer and Gauss iterations method.
Solving equations by different formulas, functions and computational tools. Examples of solutions by different methods: selection of the parameter, the method of Cramer, Gauss, iterations.
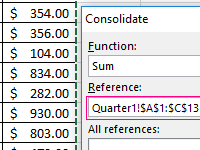 Data consolidating in Excel with examples of usage.
Let's look at the example of practical work how to do data consolidation. Combining the ranges on different sheets and in different books. Consolidated report using formulas.
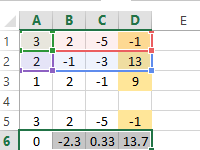
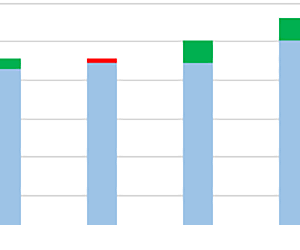 Factor and variance analysis in Excel with automated calculations.
Factor and variance analysis is easily carried out using the Data Analysis tool. For visual attention concentration on significant parameters, a diagram is added.
 Transport task in Excel with example and description.
The order of the solution of the transport task: the instruction for the closed and open type. Selection of optimal values using the tool for finding solutions.
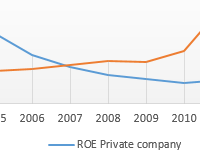 Return On Equity – ROE in Excel.
Coefficient of turnover of own financial resources: the formula for the balance sheet, the normative value, the dynamics of the parameter on the graph. The reasons for the increase, decrease and normative values of the coefficient.
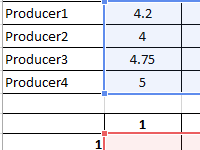
 Sensitivity analysis of the investment project download in Excel.
The method of analyzing the sensitivity of the investment project is to assess the impact of changes in input data on the final characteristics of the project. The finished analysis can be downloaded in the sample file.
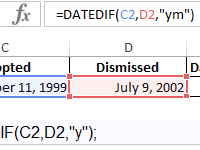 Program for calculation the seniority of work in Excel download.
The simplest functions and formulas that help to calculate the length of service in Excel. Automated universal table for calculating the length of service.
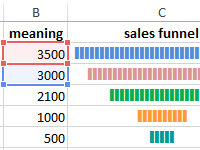 Chart of funnel sales in Excel download for free.
How to make the sales funnel in Excel using formulas, the SmartArt drawing and the Charts tool. The description of different methods with step-by-step instructions and illustrations.
