FISHER function in Excel with examples of its work
FISHER function performs the Fisher transformation for the return of the arguments X. This transformation builds a function that has a normal, not asymmetric distribution. The FISHER function is used to test the hypothesis using the correlation coefficient.
Description of the FISHER function in Excel
When working with this function, it is necessary to set the value of the variable. Immediately it should be noted that there are some situations in which this function will not produce results. This is possible if the variable is:
- is not a number. In such a situation, the FISHER function will return the error value #VALUE!;
- is either less than -1 or greater than 1. In this case, the FISHER function will return the #NUM! error value.
The equation that is used for the mathematical description of the FISHER function has the form:
Z '= 1/2 * ln (1 + x) / (1-x)
Consider the use of this function in 3-x specific examples.
Evaluation of the relationship of profit and cost function FISHER
Example 1. Using data on the activity of commercial organizations, it is required to make an estimate of the relationship between the profit Y (million) and the cost X (million) used for product development (given in Table 1).
Table 1 - Baseline:
| No | X | Y |
| 1 | 210 000 000 | 95 000 000 |
| 2 | 1 068 000 000 | 76 000 000 |
| 3 | 1 005 000 000 | 78 000 000 |
| 4 | 610 000 000 | 89 000 000 |
| 5 | 768 000 000 | 77 000 000 |
| 6 | 799 000 000 | 85 000 000 |
The scheme for solving such problems is as follows:
- Calculate the linear correlation coefficient rxy.
- The significance of the linear correlation coefficient is verified on the basis of Student's t-criterion. In this case, the hypothesis about the equality of the correlation coefficient to zero is put forward and verified. When testing this hypothesis, t-statistics is used. If the hypothesis is confirmed, the t-statistic has a Student's distribution. If the calculated value of tp > tcr , then the hypothesis is rejected, which indicates the significance of the linear correlation coefficient, and hence the statistical significance of the relationship between X and Y.
- The interval estimate for a statistically significant linear correlation coefficient is determined.
- The interval estimate for the linear correlation coefficient is determined based on the inverse Fisher z-transform.
- The standard error of the linear correlation coefficient is calculated.
The results of solving this problem with the functions used in the Excel package are shown in Figure 1.
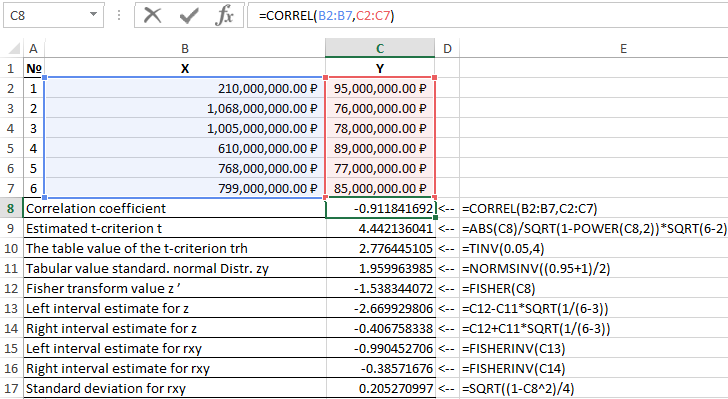
Figure 1 - Example of calculations.
| Item number | Name of the indicator | Calculation formula |
| 1 | Correlation coefficient | =CORREL(B2:B7,C2:C7) |
| 2 | Estimated t-criterion t | =ABS(C8)/SQRT(1-POWER(C8,2))*SQRT(6-2) |
| 3 | The table value of the t-criterion trh | =TINV(0.05,4) |
| 4 | Tabular value standard. normal Distr. zy | =NORMSINV((0.95+1)/2) |
| 5 | Fisher transform value z ’ | =FISHER(C8) |
| 6 | Left interval estimate for z | =C12-C11*SQRT(1/(6-3)) |
| 7 | Right interval estimate for z | =C12+C11*SQRT(1/(6-3)) |
| 8 | Left interval estimate for rxy | =FISHERINV(C13) |
| 9 | Right interval estimate for rxy | =FISHERINV(C14) |
| 10 | Standard deviation for rxy | =SQRT((1-C8^2)/4) |
Thus, with a probability of 0.95, the linear correlation coefficient lies in the interval from (–0.386) to (–0.990) with a standard error of 0.205.
Checking the statistical significance of the regression by the FINV function
Example 2. To verify the statistical significance of the multiple regression equation using Fisher's F-test, to draw conclusions.
To test the significance of the equation as a whole, we hypothesize H0 about the statistical insignificance of the coefficient of determination and its opposite hypothesis H1 about the statistical significance of the coefficient of determination:
H0 : R2 = 0;
H1 : R2 ≠ 0.
We test the hypotheses using the Fisher F-criterion. The indicators are shown in table 2.
Table 2 - Baseline
| Indicator | SS | MS | Fcalc |
| Regression | 454,814 | 227,407 | 7,075 |
| Remainder | 1607,014 | 32,14 | |
| Total | 2061,828 | - |
For this we use the function in Excel:
=FINV(α,p,np-1)
Where:
- α is the probability associated with a given distribution;
- p and n are the numerator and denominator of the degrees of freedom, respectively.
Knowing that α = 0.05, p = 2, and n = 53, we obtain the following value for Fcrit (see Figure 2).
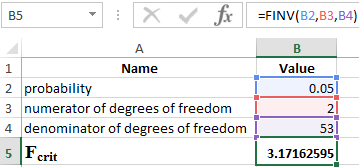
Figure 2 - Example of calculations.
Thus, we can say that Fcalc > Fcrit. As a result, the hypothesis H1 about the statistical significance of the coefficient of determination is accepted .
Calculation of the correlation index in Excel
Example 3. Using data from 23 companies on: X - the price of product A, thousand; Y - profit of commercial enterprise, study of their dependence is made. Evaluation of the regression model gave the following: ∑(yi-yx)2 = 50,000; ∑(yi-yср)2 = 130000. What correlation indicator can be determined from this data? Calculate the value of the correlation indicator and, using the Fisher criterion, draw a conclusion about the quality of the regression model.
Define Fcrit from the expression:
Fcalc=R2/23*(1-R2)
where R is the coefficient of determination equal to 0.67.
Thus, the calculated value of Fcalc = 46.
To determine Fcrit, use the Fisher distribution (see Figure 3).
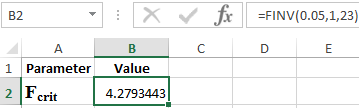
Figure 3 - Example of calculations.
Download examples functions FISHER in Excel
Thus, the resulting estimate of the regression equation is reliable.
