PEARSON function for calculating the Pearson correlation coefficient in Excel
PEARSON function is used to calculate the Pearson correlation coefficient r. This function is used in the work when it is necessary to reflect the degree of linear dependence between two data arrays. In Excel, there are several functions with which you can get the same result, but the universality and simplicity of the Pearson function make a choice in its favor.
How does PEARSON function in Excel?
Consider an example of calculating the Pearson correlation between two data arrays using the PEARSON function in MS EXCEL. The first array represents the temperature values, the second pressure in a certain summer period. An example of a filled table is shown in the figure:
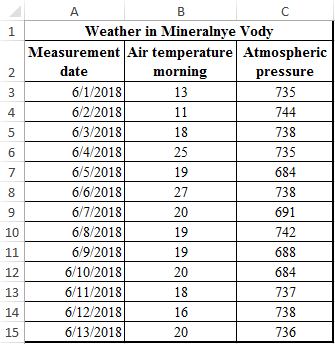
The task is as follows: it is necessary to determine the relationship between temperature and pressure for the month of June.
An example of a solution with the function PEARSON when analyzing in Excel
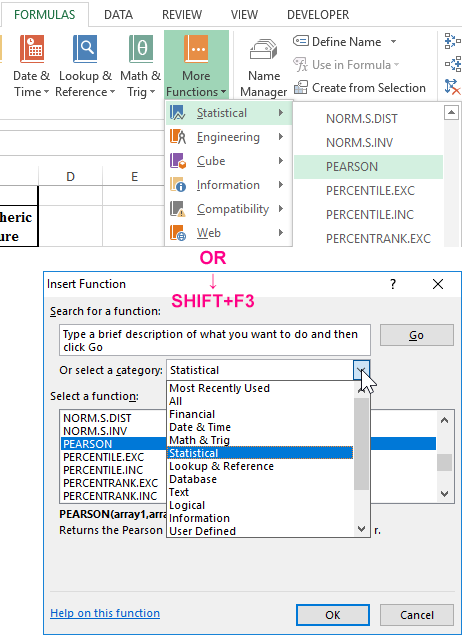
- Select the cell C17 in which the Pearson criterion should be calculated as the result and press the “fx” function master button or the hot key combination (SHIFT + F3). The function wizard opens, in the Category field, select “Statistical”. In the list of statistical functions, select and click Ok:
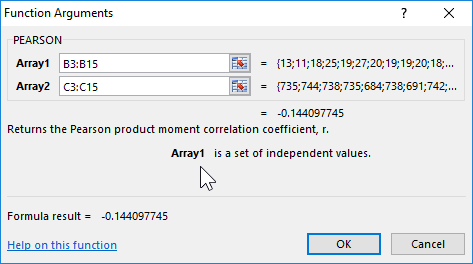
- In the arguments menu, select Array 1; in the example, this is the morning air temperature, and then Array 2 — atmospheric pressure.
- As a result, in cell C17, we obtain the Pearson correlation coefficient. In our case, it is negative and approximately equal to -0.14.
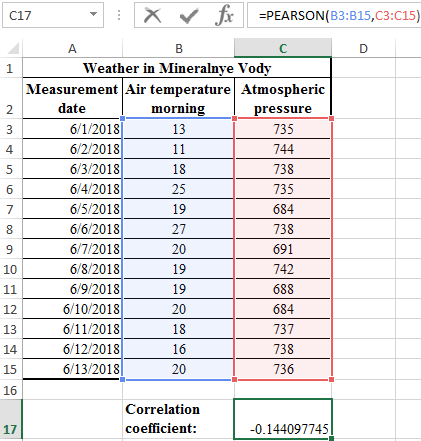
This indicator -0.14 by Pearson, who returned the function, indicates an unfavorable dependence of temperature and pressure at an early time of day.
PEARSON function step by step instruction
The correlation coefficient is the most convenient indicator of the conjugacy of quantitative traits.
Task: Determine the linear Pearson correlation coefficient.
Solution example:
- The table shows data for a group of smokers. The first array x - represents the age of the smoker, the second array y represents the number of cigarettes smoked per day.
- Select the B4 cell in which the result will be calculated and press the fx function master button (SHIFT + F3).
- In the Statistical group, select the PEARSON function.
- Select Array 1 - smoking age, then Array 2 - the number of cigarettes smoked per day.
- Press the OK button and see the criterion for the normal Pearson distribution in cell B4.

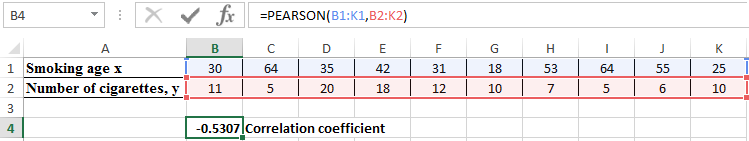
Thus, according to the result of the calculation, the statistical conclusion of the experiment revealed a negative relationship between age and the number of cigarettes smoked per day.
PEARSON correlation analysis in Excel
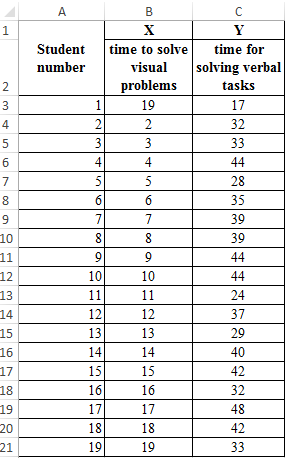
Task: students were given tests for visual and verbal thinking. The average time to solve test tasks in seconds was measured. The psychologist is interested in the question: is there a relationship between the time for solving these problems?
Example of a solution: we present the source data in the form of a table:
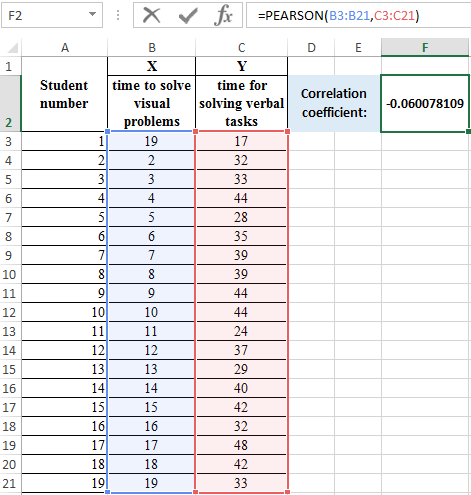
- Move the cursor to the cell F2. Open the fx function wizard (SHIFT + F3) or enter it manually.
- Choose function.
- Select the array1 B3:B21 with the mouse, then the array2 C3:C21.
- Press OK and in cell F2 we get the Pearson compatibility criterion.
Interpretation of the result of the calculation according to Pearson
The value of the Pearson linear correlation coefficient cannot exceed +1 and be less than -1. These two numbers +1 and -1 are the boundaries for the correlation coefficient. When the calculation results in a value greater than +1 or less than -1, therefore, an error has occurred in the calculations.
If the modulus of the correlation is close to 1, then this corresponds to a high level of coupling between the variables.
Download examples PEARSON function for correlation in Excel
If the minus sign is received, then the larger value of one sign corresponds to the smaller value of the other. In other words, in the presence of a minus sign, an increase in one variable (sign, value) corresponds to a decrease in another variable. This dependence is called inversely proportional. These provisions are very important to clearly understand for the correct interpretation of the obtained correlation dependence.
