Analysis of the investment project to download in Excel
Any investment needs careful calculations, otherwise the investor risks to lose to the invested funds.
At first glance, the business is profitable and attractive for investment, but this is only on the first impression. You are required thorough analysis of the investment project. And you can do this yourself using the Excel program, without the involvement of specialists and experts for the management investment portfolios.
The calculation of the investment project in Excel
The Investor invests the money in the ready enterprise. Then it is necessary to assess him to the work efficiency (profitability, reliability). In any new business all calculations are based on the data obtained in the course of studying of the market (infrastructure, incomes, rate of inflation, etc.).
Let consider to creating of the business from scratch – we calculate the profitability of a company using formulas in Excel. As the example, we will take to the conditional goods and the numbers. It is important to understand the principle, but you can substitute any data.
So we have the idea to open to a small shop. Let decide with the cost, they can be:
- the permanent (it is impossible to calculate per unit of a product);
- the variables (it is possible to calculate per unit of a product).
The initial investment is 300 000$. Money is spent on design of the entrepreneurship, on the equipment, the purchase of the first lot of goods, etc.
Draw up to the table with fixed costs:
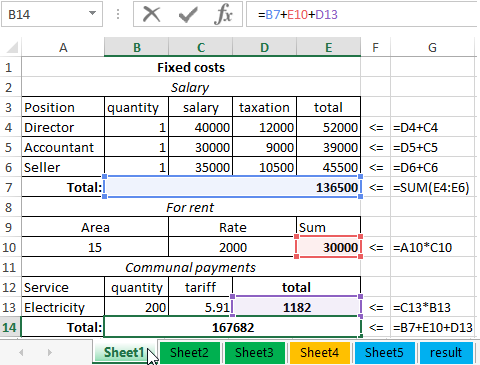
* The expenditure is individual, but the principle of making is understandable.
By the same principle we make the separate table with variable costs:
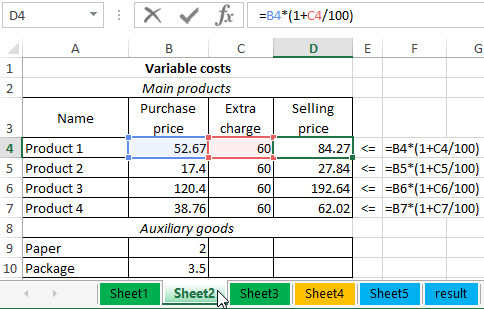
For finding of the sales price was used to the formula: =B4*(1+C4/100).
In the next stage, we forecast to sales volume, revenue and profit. This is the most important stage in the preparation of the investment project.
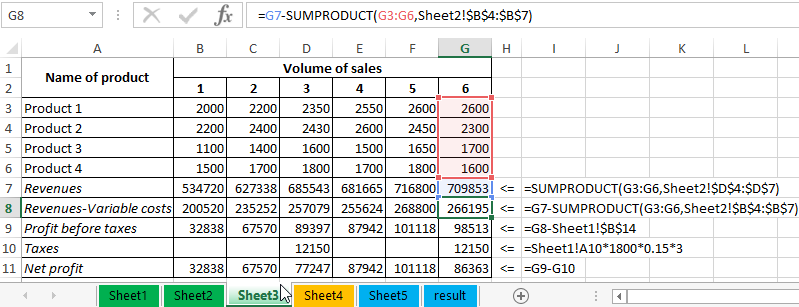
The sales volume is contingent. In real life these figures are the result of analysis of incomes, of a demand for goods, of an inflation rate, of a season, of a location of outlets, etc.
For calculation of the proceeds was used formula:
Where the first array is volume; the second array are selling prices.
There is revenue minus variable costs:
The profit before payment of taxes: =B8-Sheet1!$B$14 (is the revenue without variable and fixed costs).
Taxes UTII: =Sheet1!A10*1800*0.15*3 (1800 – is the benchmark return by type of activity, 3 – is the number of months, C 12 – is area of the room).
The net profit: is profit – taxes.
The assessment of the investment project in Excel
To expect 4 of the major indicators:
- the Net Present Value(NPV);
- the Profitability Index of the investment (PI);
- the Internal Rate of Return (IRR);
- the Discounted Payback Period (DSO, DPP).
Let`s take for example the following investment option:
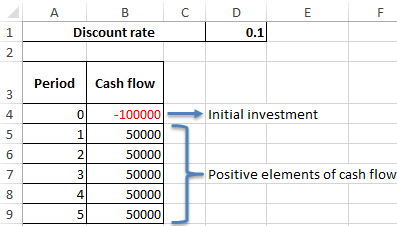
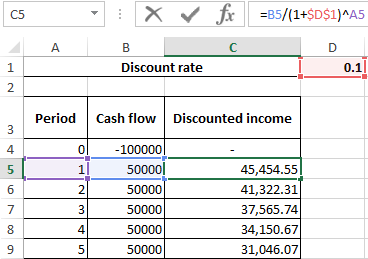
At first we need discontinue every positive element of the cash flow.
Let`s create a new column in which we to input the formula: = positive element of the cash flow / (1 + discount rate) ^ the degree, which equal to the period.
Let`s calculate the Net Present Value now:
- With the helping of the SUM function.
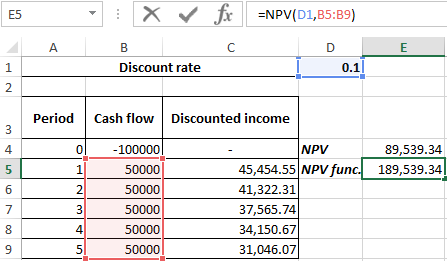
- Using the built-in NPV function.
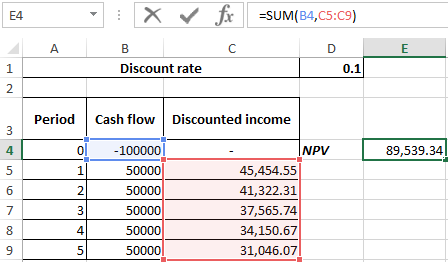
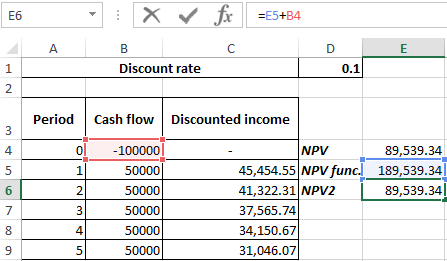
To obtain the net present value, we add the function result with the amount of investment. The numbers matched:
Let`s to find the index of the profitability investments. To do this, we need to divide the net present value (NPV) on the amount of invested assets (with the sign «+»):
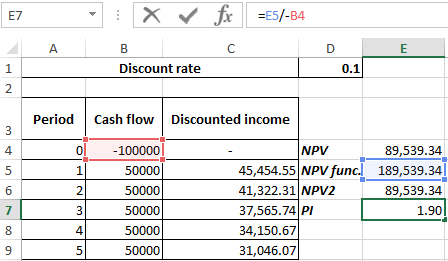
The result is 1.90.
Let`s calculate the IRR of the investment project in Excel.
The internal rate of return – is such rate of discount, at which the equality gets:
The NPV = 0.
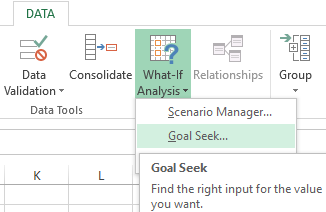
Using to the tool «Analysis «What-If»:
- We put the cursor in the cell of the net present value value. Select «DATA»-«What If-Analysis»-«Goal Seek».
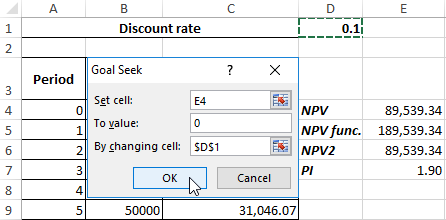
- In the opened window in the field «Value» we enter 0 (the net present effect must be equal to 0). In the «Changing cell value» we refer to the discount rate. You need to change it, that to comply with the above equality.
- Press OK.
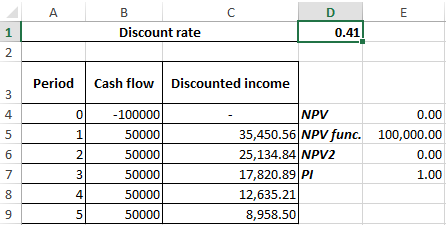
The discount rate is equal to 0,41. Consequently, the internal rate of return is 41%.
Risk modeling of the investment projects in Excel
We need to use the simulation method Monte-Carlo. The goal is to replicate of the business development, which is based on the results of the analysis of known elements and interconnections between them.
Show all your risk modeling from the simplest example. We will make to the conditional template with the data:
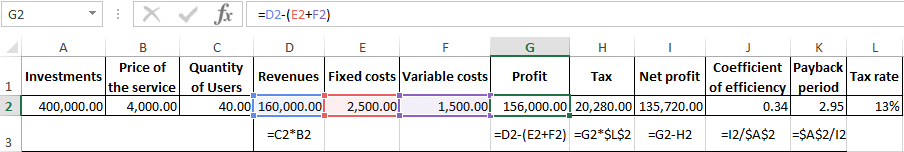
The cells that contain formulas are signed by their values respectively.
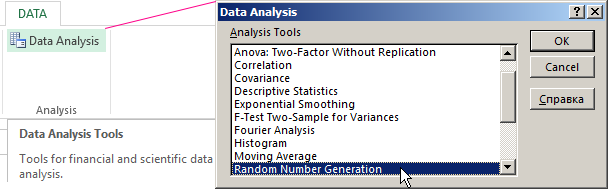
The projections – are the price of services and number of users. Under these data, we record the «Simulation Results». On the «DATA» tab, we click «Data Analysis» (if there's no of the tool we will have to connect the Add-Ins). In the opened window, we select «Random Number Generation».
We to fill in the parameters as follows:
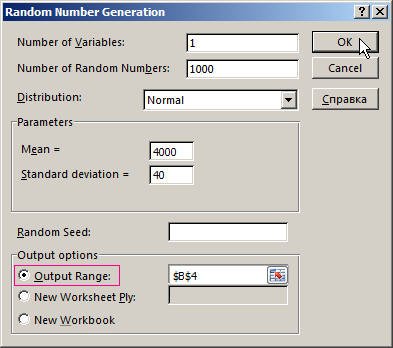
We need to simulate to the situation, which based on the distributions of various types.
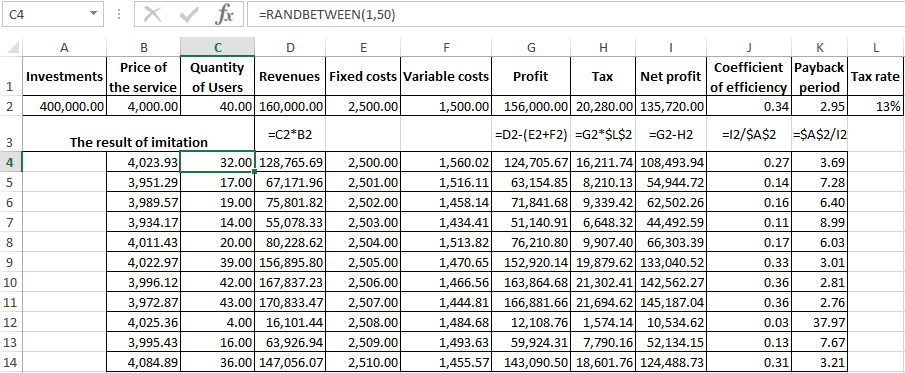
For generating the number of users we use of the function =RANBETWEEN(1,50). The lower bound (if the worst variant of events) – is 1 user. The upper limit (with the best variant of the business development) – is 50 buyers of services.
We copy of resulting values and the formulas for the whole range. For variable costs, we will do to the random number generation. We get to the empirical distribution of the performance indicators of the project.
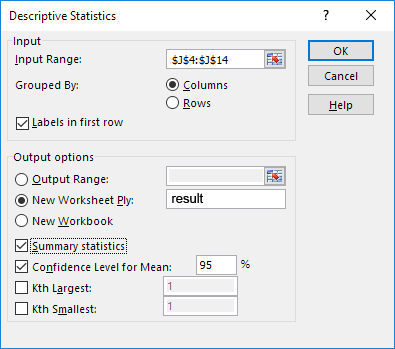
To assess the risks, we need to do economic and statistical analysis. We use of the tool «Data Analysis» and to select «Descriptive Statistics».
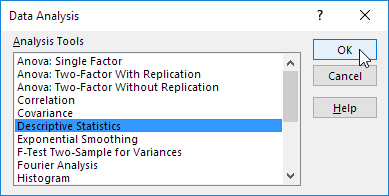
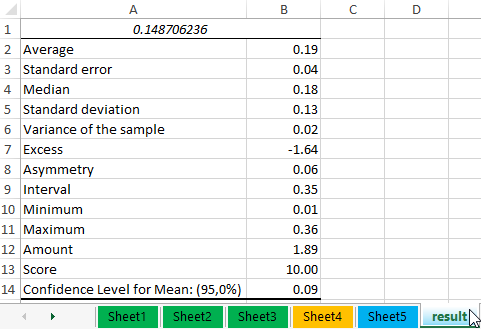
The program gives to the result (the column «Coefficient of efficiency»):
Download to the analysis of the investment project in Excel.
You can draw conclusions and to make a final decision.
