Added value excel dashboard example free download
Example of a dashboard template for calculating and visually analyzing value added in Excel. Let's look at the design and principle of the practical use of dashboard, as well as the basic basics on the most important financial and economic indicator - value added.
Dashboard template for value added visualization in Excel
To model the task, let's first take a basic look at the popular financial term value added and the principles of its formula for calculating it in Excel. How it works for businesses and what happens in macroeconomics for a particular business.
Value added is essentially that part of the value within the price of the products produced those businesses add by their own efforts, which is simply put - it is the contribution that is invested in the value of the product.
The structure of the price and how is the value of the product formed?
The principles of adding value work for any activity, whether it's service delivery or production or even trade. After all, trade is the most beautiful part of production. Any product can be called a commodity only when its value has been paid by the consumers' choice. Until then, any product is still a manufactured commodity, but with great potential to close a consumer's need for financial reward.
That is, in different spheres of activity, approximately the same thing will happen just in different proportions with different features. Let us consider the process of adding value on the example of the output of commodity products.
Costs of inputs and materials are NOT included in value added!
So, in order to produce each commodity unit, we need to purchase:
- Assets - materials and raw materials from which the product will be made. These may be the main components of some or, as an auxiliary additional materials. All production materials and raw materials become current assets, which are then converted into finished products.
- Resource - all other purchased factors of production. For example, to make the shop work you need electricity, water, rent for storage, etc.
- Depreciation - these are fixed assets or non-current assets of production. Investments in research and development, patents. That is, everything that is ultimately non-current assets and then depreciated in the process.
All of the above funds are received from outside suppliers and contractors then this falls into this category.
Labor remuneration plus profit is value added
If the production base was created by their own efforts in that case it belongs to another category - labor! But in general, labor refers to the usual hiring of workers to produce a product.
- Salary. In our example, labor is any payments to employees, any salary, and it does not matter whether this salary was paid during the creation of the production base, during the creation of non-current assets, internal labor of the enterprise, or it is labor in the course of the normal current activities of the enterprise.
- Profit. The main part of the added value.
Labor and profit are the added value that an enterprise creates. Materials, purchased inputs, and means of production that transfer their value through depreciation are no longer value added, but are transferred to external suppliers.
What is the difference between value added and cost of goods?
This is the key difference between value added and the cost of production. Everything that is put into the price of a commodity other than profit is its cost of production. At the same time, value added is profit plus labor remuneration. From the above material, we derive the formula for calculating value added in Excel:
Added Value AV = Profit + Wages
Or as follows:
AV = Price of finished goods - (Production materials + Production factors + Non-current assets)
Profit is the result of the enterprise.
Please note that we do not consider taxes here, as this is a basic overview of the main financial and economic indicator of the effectiveness of the enterprise. We assume that all taxes, which refer to something, are within these categories of the value of goods.
Visualizing the structure of added value in Excel
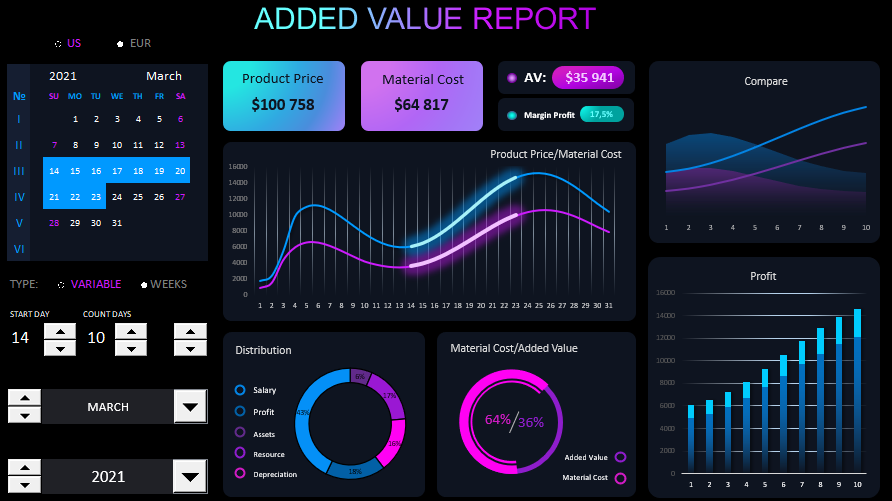
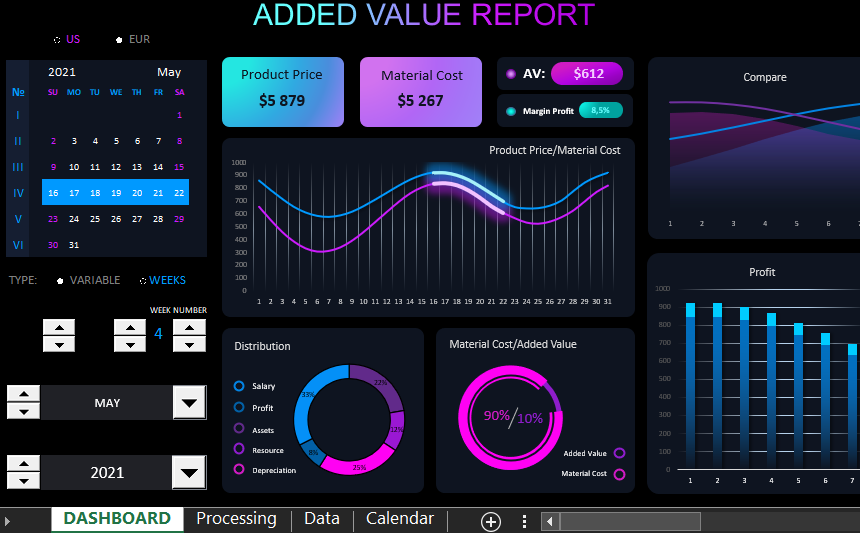
Based on the data from the above material, we visually analyze the dashboard.
On the right side there is a control panel for the interactive features of the dashboard. The first block is a visual calendar with the ability to switch between American (US) and European (EUR) style day formats.
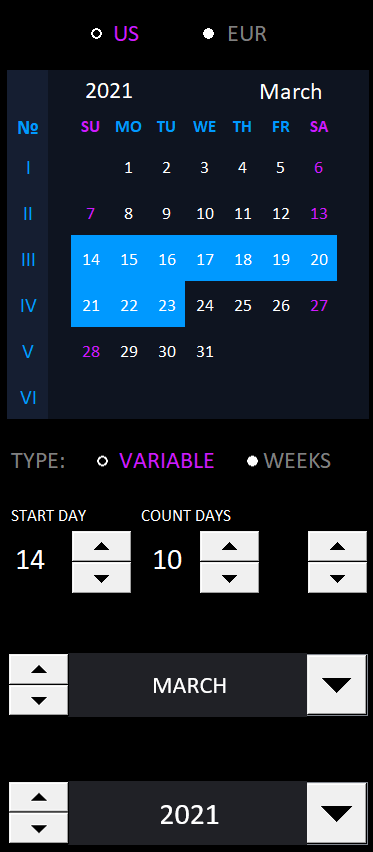
A blue marker will highlight the selected days, which will be visually displayed on the dashboard against all the data for detailed analysis. On the right side, the week numbers are numbered in Roman numerals. The switch for the displayed calendar styles is at the very top.
To specify the start date of the selected period and the number of days selected, controls of the - counter type are used. For example, on the picture you can see the period starting from the 14th of March, 2021. The number of days in the selected period is 10.
Below the calendar there is another switch for convenient selection of periods by weeks:
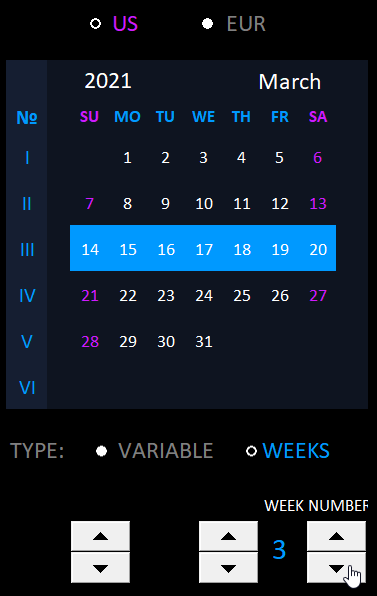
When you switch to this mode, you can select the calendar days by weeks. For example, in this case the third week of the current month is selected. And now you don't need to adjust the beginning of the period 14, the number of days 7, etc. You just switch the week numbers and Excel formulas automatically highlight the selected days of the week. This is very convenient and saves the dashboard user a lot of time.
Below these controls are tools for selecting month and year on the calendar. You can switch between months and years with either a counter or a drop-down list - it's also usable for the user of interactive data visualization.
In the very center of the value-added presentation is a chart of the current month's prices and material costs:
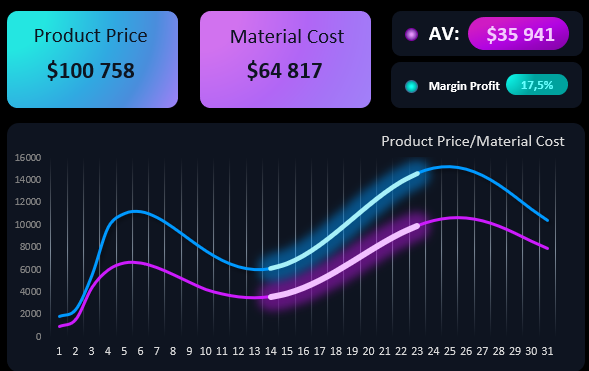
The range of selected days is highlighted in bright colors for display against the general background of the data. Above the chart is a summary of the selected period: the sum of prices, material costs, and the amount of value added in the selected date range on the calendar.
In the corner top box on the right side of the visualization is a sparkline for quick comparative analysis, the currently selected and the previous data period with the same number of days:
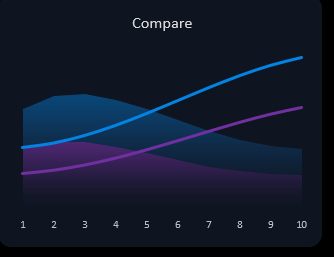
If data is selected for the first week at the beginning of the current month, then it will be compared to the last days of the previous month with the same number of days. All things considered!
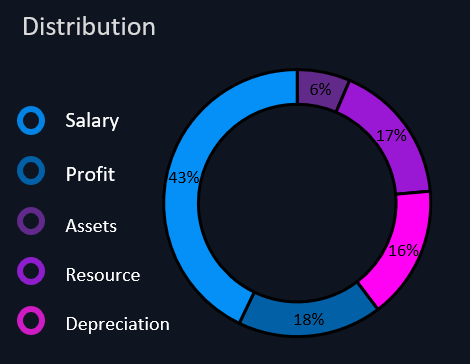
The bottom part of the presentation visualizes in detail the structure of the added value according to the data of the indicators for the selected accounting period on the interactive calendar:
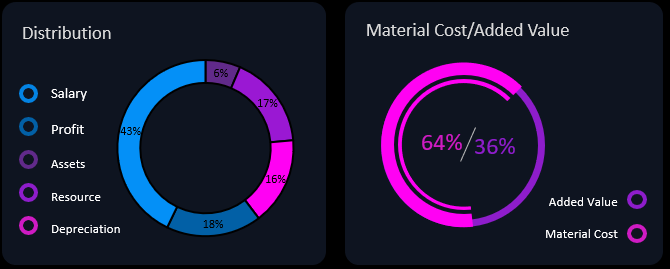
On the left is the price structure, where you can clearly see what share is taken by the elements of value added (price and wages). You can also see the share of each element that makes up the price in the current data period.
On the right is the overall ratio of the shares of value added and material costs as a percentage of the indicator.
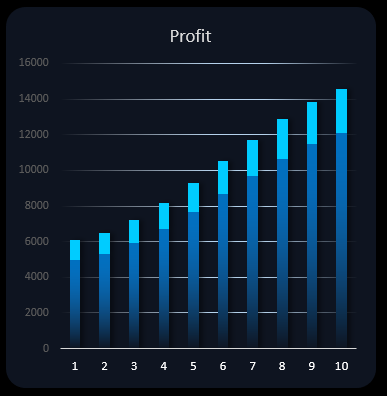
And finally, the last block in the bottom right corner is the level of daily net profit in the prices of goods sold for each day in the exhibited data period:
All blocks merge harmoniously into one holistic picture of data visualization for the analysis of the added value of the goods produced by the enterprise:
 Download an example of added value in Excel
All input data for the visualization example are traditionally on the "Data" sheet. But the calculation formulas this time are located on two sheets "Processing" and "Calendar". Use this example as a template for your visual data analysis needs and requirements. Modify it as you see fit. The template contains no macros, all interactive automation is implemented using Excel formulas and standard spreadsheet cell value control tools.
