Example of Cash Flow visual analysis on Combo Chart Excel
A Cash Flow report allows you to predict future financial performance and prevent cash gaps. That's why it is so important and so popular. But among the standard Excel charts there are no suitable tools for visualizing Cash Flow report data. Here is an unusual example of creating a combined chart to visually analyze the circulation of cash flow in an enterprise.
Combined chart for visual analysis of Cash Flow in Excel
Since the standard Excel charts do not have a suitable tool in the arsenal for analyzing the Cash Flow report, we will combine our chart from the already available tools. This example uses a combination of three separate charts:
- Bubble chart.
- Pie chart.
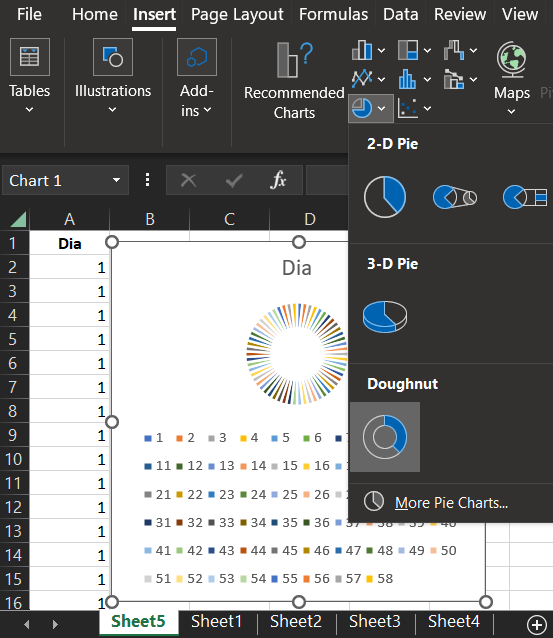
- Combined of the two Doughnut Diagrams.
A detailed description of the purpose and strategy for each item:
- Bubble - designed to visually compare the value of more than two values.
- Pie - displays the ratio of multiple parts to a whole total value. It is not recommended in the ethos of visual report designers and developers to use a pie chart to compare more than 2 values. But in our creative combination, we will use it to display the exposed value of financial plan outperformance greater than 100% on the same chart. Although essentially everything is kept within the visualization design ethic as it uses 2 values: 1 - the percentage of the over-exposure to the plan versus 2 - the total integer value of 100%.
- Doughnut - as well as the circular is designed to display multiple fractions in relation to the whole of the total value. But unlike the circular chart, it can contain several rows of data. This difference will come in handy when developing a data visualization design for an interactive presentation.
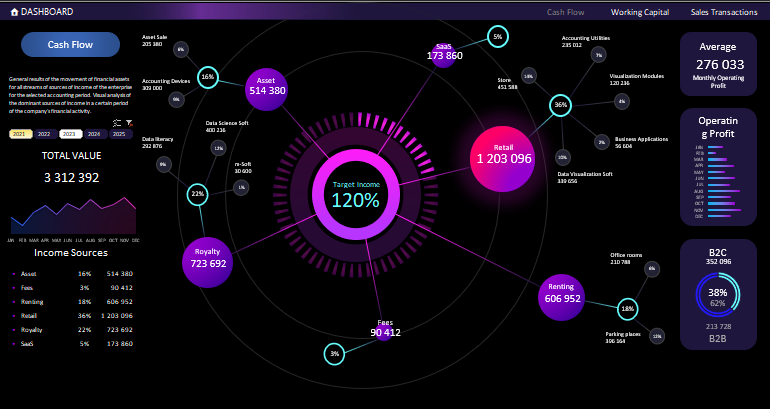
One of the most important purposes of the Cash Flow report is to prevent cash gaps. Therefore, our combo chart will contain a large combo chart in the center, informing you of the percentage of sales plan fulfillment. The higher the percentage, the less likely a cash gap will occur. Diagram of what the future visualization design will look like:
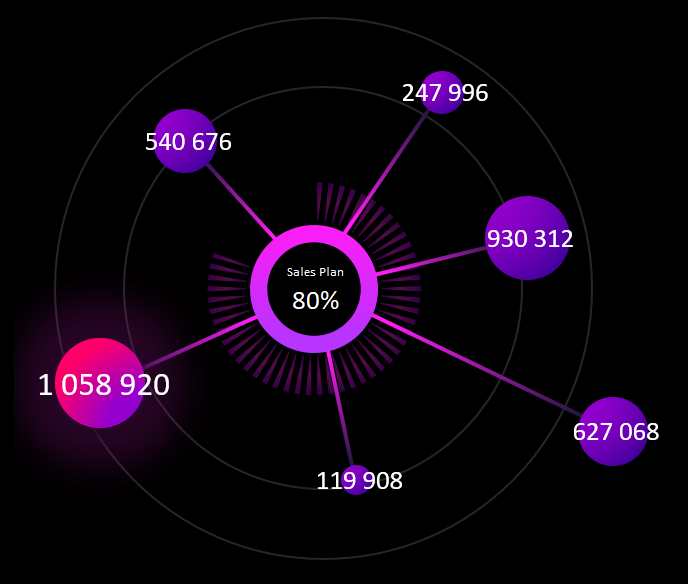
The technical specification for the developer is defined, shown and described. Now we can move on to the process of implementing the task.
Assembling a combo chart in Excel step-by-step
Let's break down this example in step-by-step instruction style:
- Create a 58-division circular scale:
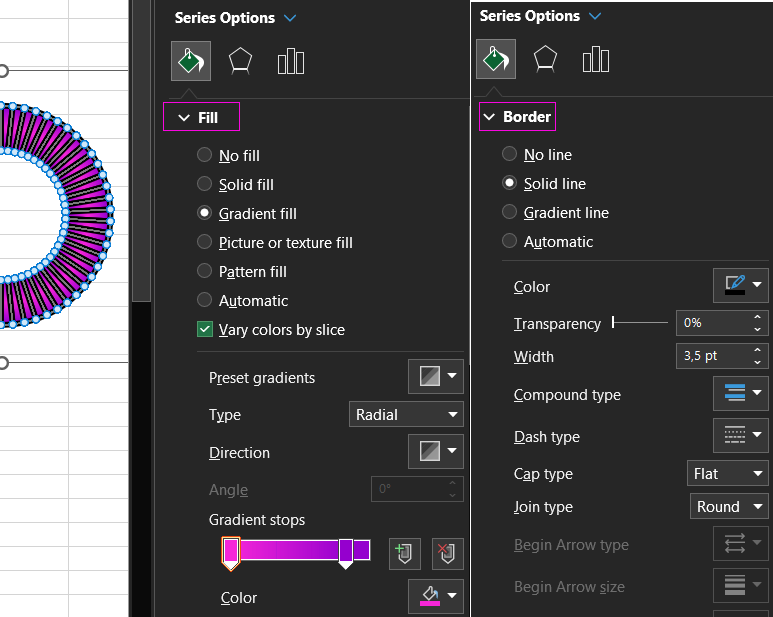
- Design a design for the divisions on the circular scale:
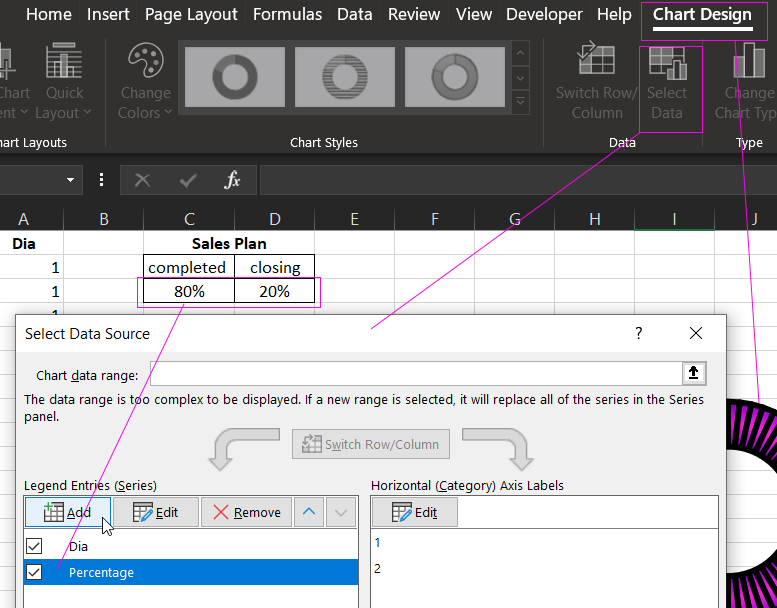
- Add a new series of values to combine the chart:
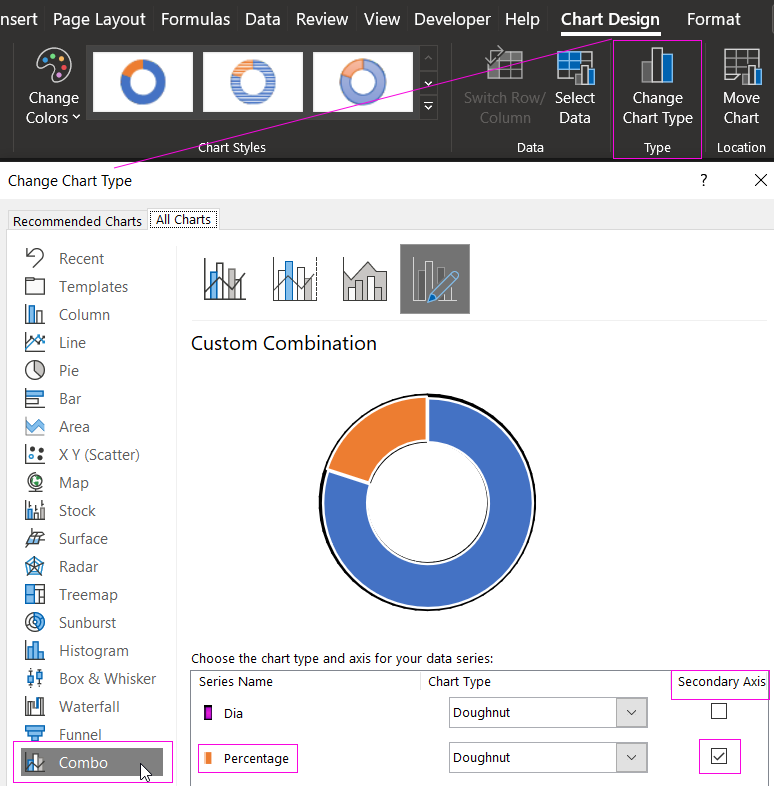
- Customize the combination in the type change window. Note that you need to specify an auxiliary coordinate axis location for the second series of values. This way the two ring diagrams will be superimposed as on different layers:
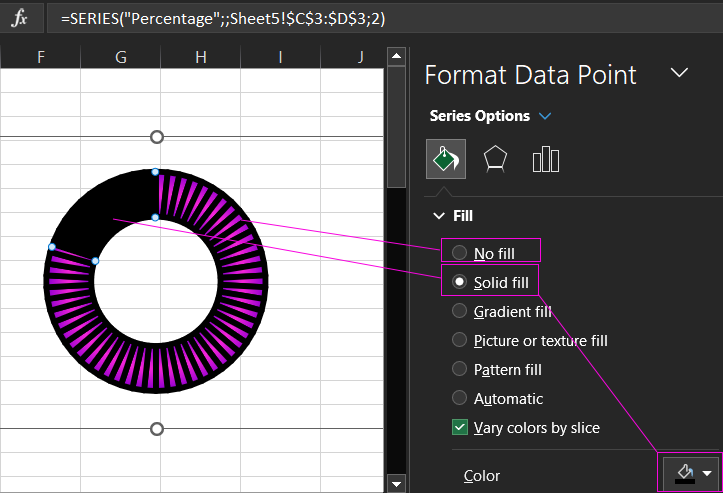
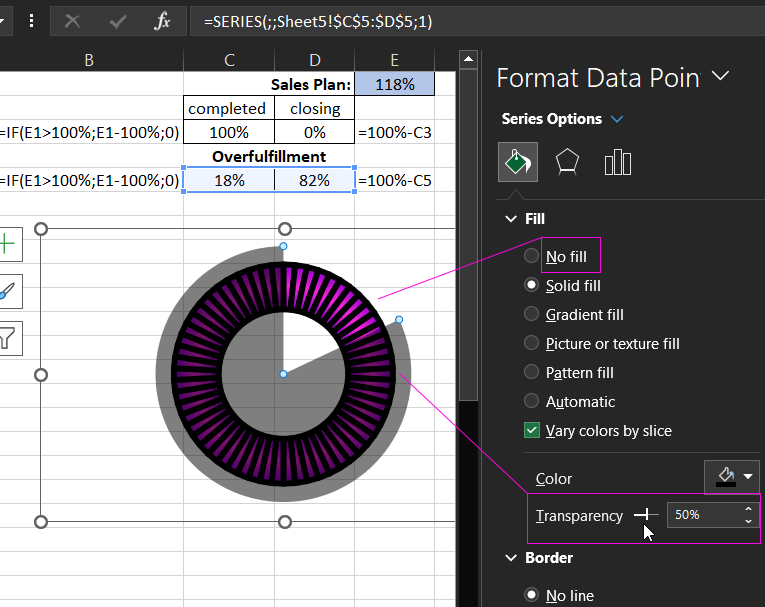
- Change the design for the second ring diagram, additionally superimposed on top with the type combination in Excel. We change the blue fill to transparent, and the orange to black. And don't forget to remove the outlines. The combined chart of the two circles is ready:
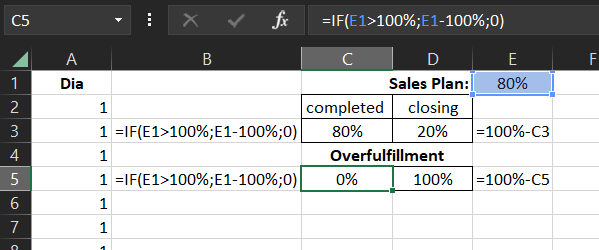
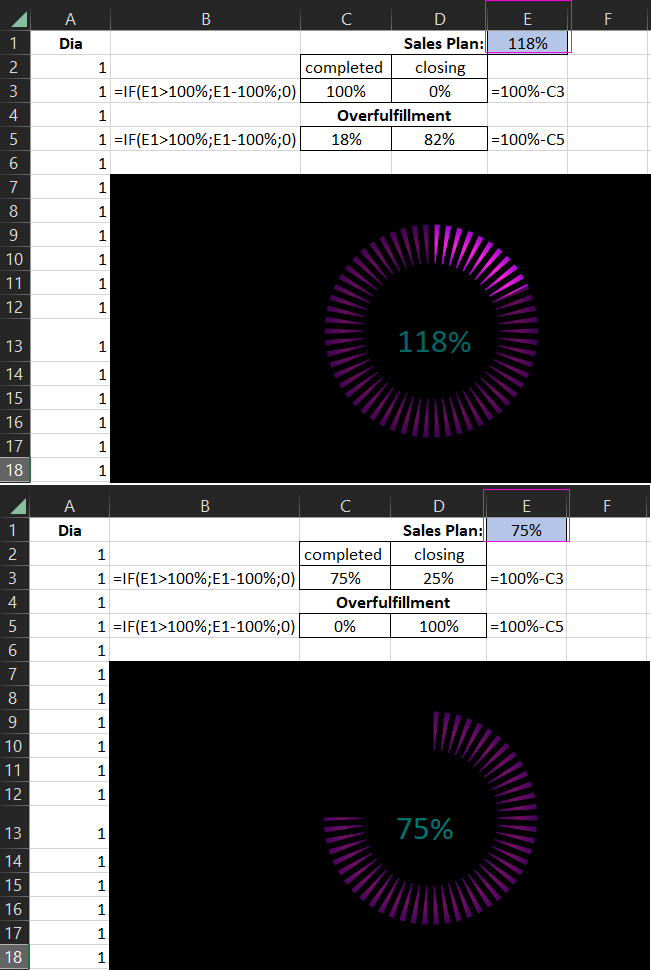
- Change the values to formulas in the sales plan table. And also create another table with formulas for the initial values of the pie:
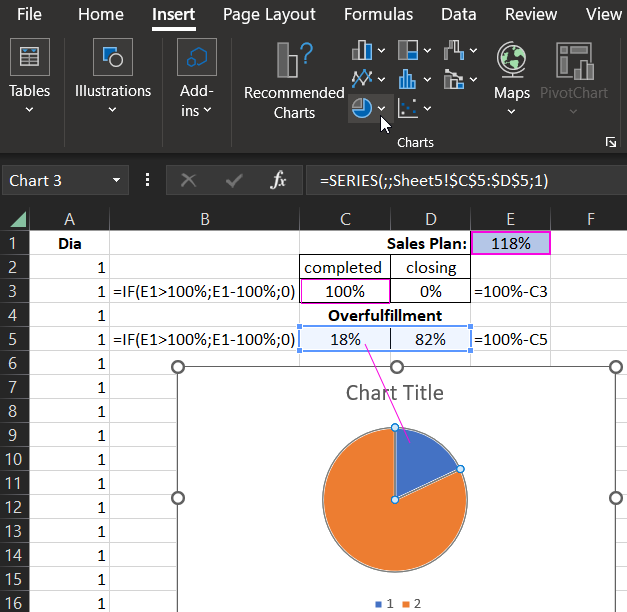
- Based on the second table, create a pie diagram that exposes the proportion on the scale corresponding to the values when the sales plan is exceeded:
- Change the fill colors of the pie and superimpose it on the combined pie chart consisting of two pie charts. Do not forget to adjust the dimensions. Change the blue color to transparent and make the orange a black but semi-transparent fill and remove all the contours:
- Test and enjoy the finished result on a black background and check how everything works when you change the original value in cell E1:
- We add the bubble chart as the last combination in the overall composition of the cash flow circulation report presentation:
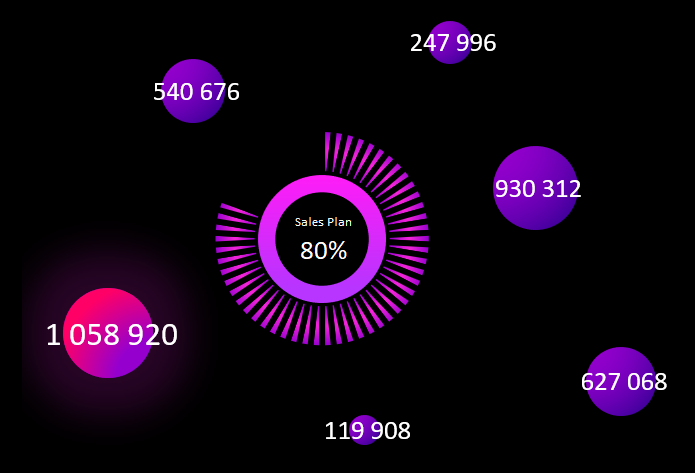
Next, we arrange everything in a beautiful and talented way to create a professional infographic with interactive features. It all depends on your imagination, and it depends on inspiration:
 Download Cash Flow Analysis in Excel Combined Chart
Excel's wide range of data visualization tools has everything and more than meets the eye. All it takes is a little experience, and imagination will come with creative inspiration. Feel free to download this template and be inspired, modify to your needs and improve. There is no limit to perfection, there are no boundaries between the soul and creativity.
