Dashboard and visual report Designer download in Excel
We offer a simple dashboard constructor version 1.0, which can be downloaded for free from the link at the end of the article. Using this template to design visualizations according to your source data, you have the ability to display only important information for you on the panel. At your disposal is a library of 13 charts and charts.
Dashboard Constructor from Excel charts and charts
I designed such a constructor where you can sketch out a report using one of the most popular metrics for analyzing sales performance by week with a few clicks of the mouse. Consider the functionality of the designer and the rules for its use. But first, the dashboard constructor template must be filled with the source data.
Filling in the source data
The incoming data for further processing and visualization must be filled in the table on the "Data" sheet:
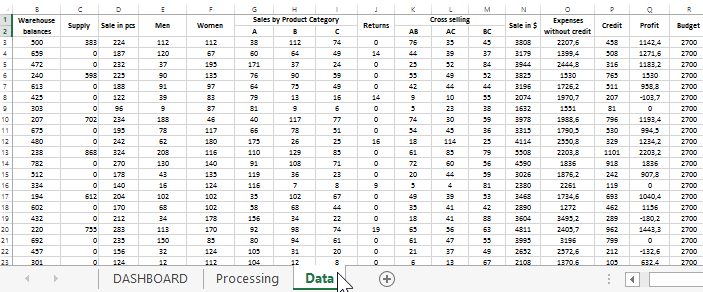
The name of each column speaks for the statistical indicators with which their cells should be filled:
Date is the ordinal date of each day of the year 2024. All data will be broken by the designer into weeks.
Balances in warehouses - the amount of goods in balances as of the end of the current day. The balances are already calculated after adding the amount of the capitalized goods and subtracting the sales of goods in pieces as of the current day.
Delivery - the amount of the capitalized goods.
Sale - the total amount of goods sold per day.
For men - how much product was sold to men.
Women - how many women were among the buyers.
Sales by product category (ABC) - sales segmentation: how many units were sold in each category (no returns).
Refunds - how many refunds were in pieces.
Cross-selling - how many upsells were made for pairs of categories AB, AC and BC. Thus, statistics are indicated here as categories of goods interact with each other thanks to different cross-selling techniques that help to influence consumer choice. For more on cross-selling, see the cross-selling interaction chart below.
Sale in $ - the amount of goods sold in dollars as of the current day.
Expenses without credit - the amount of expenses that do not take into account the attraction of credit funds. It is advisable to separately spend expenses on loan repayments in order to always really evaluate the capabilities of the company during the financial crisis. For more details, see the description of the bar chart “Sales volume” of this dashboard template.
Credit - expenses on repayment and servicing of credit investments.
Profit - net profit (total revenues minus total expenses).
Budget - the amount of the budget pledged to cover expenses for the current day.
The dashboard designer uses 13 elements to visualize metrics. If you need to use all of them, then you need to fill in all the columns on the “Data” sheet.
Dashboard data processing engine
The whole mechanism for reading and processing the source data is on the sheet with the formulas "Processing":
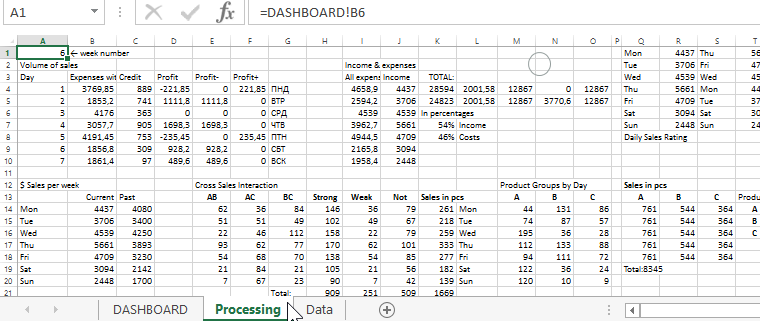
Here a lot needs to be described, but it is better to download the finished example file and see all the formulas on this sheet. Each block of formulas is also signed as the name of the chart or chart that refers to it.
Excel Dashboard Designer interface
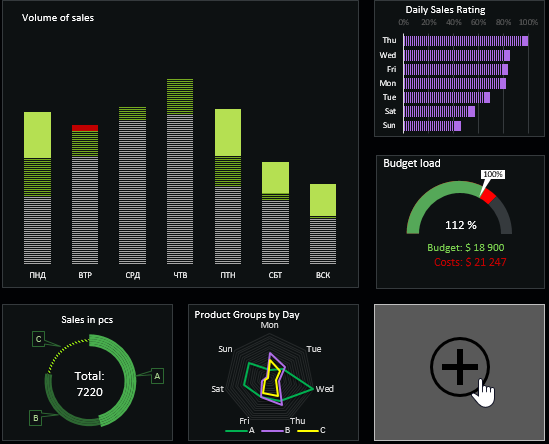
On the main sheet of "DASHBOARD" are the controls for the designer, dashboard and chart blocks with charts.
On the left side there is a control panel for selecting the current week number, which should be displayed on the dashboard:
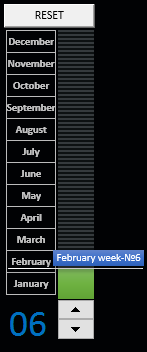
You can switch between weeks in two ways:
- Using the switch control "Counter" (up and down arrows).
- By directly entering a numerical value of 1-53 into cell B6 so that it quickly moves on the scale.
To add a new block with visualization of the desired metric for the indicators of the current week, select 1 of the 9 blocks by clicking on it with the left mouse button:

As a result, a window with thumbnails of the type of metric chart appears:
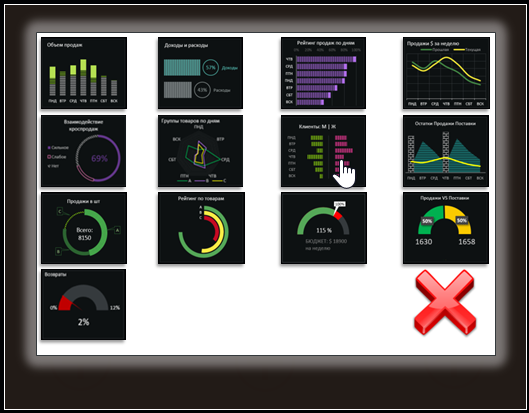
Select the desired schedule by clicking on it with the mouse. As a result, a block with the selected schedule will appear on the dashboard.
Attention! To change the chart in the same block in order to display a different type of metric visualization in it, you must first delete it and only then add a new one.
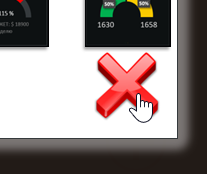
To remove a chart from the dashboard block, click on it to open a window with thumbnails of visualization of metrics and in the same window select the button with a red cross in the lower right corner:
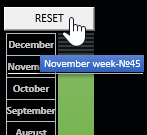
Also, you can immediately delete all charts and charts from the dashboard using the reset button, which is located above the scale of accounting periods:
We pass to the following designer control:
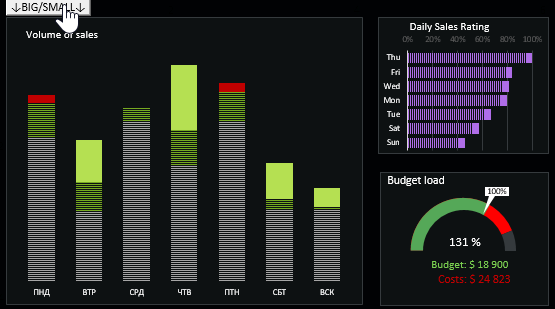
At the top opposite the first block is a button toggle the size of the chart display in this block: large (4-fold increase) and small - standard size.
This is all you need to design your dashboards with various weekly reports based on your source data. Next, we consider the entire library of charts in more detail.
Description of the Dashboard Designer library from charts and charts
The first chart “Sales volume” is a bar chart that displays sales amounts divided by the shares of their component parts:
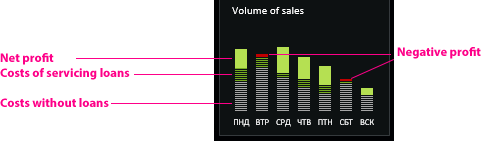
- Expenses without loans (gray striped row).
- Costs of servicing loans (green striped row).
- Net profit (green row).
- Negative profit (red row).
An important feature of the presentation of these metrics is the separate exposure of indicators for credit resources. In modern business, one should carefully monitor the performance of the enterprise in two planes: with and without credit resources. Thus, it is possible to really assess the business survival opportunities during the period of financial crises. After all, if modern business does not use additional credit resources at all, then it will lose to competitors who are effectively using loans to boost growth in the volume of financial and commodity circulation.
This chart does not contain a vertical axis Y, since its basis is the task of showing on which day of the week the largest or smallest sales volume was. And also what proportion each part of the volume individually on a given day makes up.
On the other hand, if a financial crisis comes, then credit resources will go up sharply, and for many firms they will even be inaccessible, which can lead to sad consequences. Therefore, you should constantly monitor the level of business independence from loans.
This chart has the ability to display the share of negative profits, because there are days when expenses exceed revenues. The negative difference between incomes and expenses is displayed by a share of red color on the histogram. They signal that the business owner should urgently change the strategy.
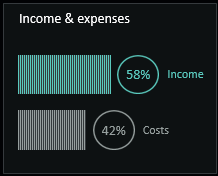
The following schedule is “Income and expenses”. Displays the ratio of expenses to income in percent for a weekly accounting period of time:
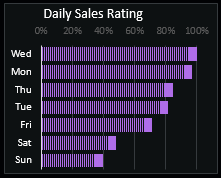
The bar chart “Rating of sales by days” displays the rating of the most successful days in sales for the current week and the ratio of other days to the top day of the flagship. The indicators are automatically sorted in descending order:
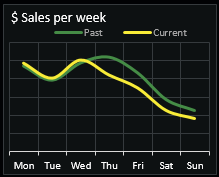
“Sales $ per week” - displays on the dashboard screen a comparison of sales in money for the current week in relation to the previous one:
“Cross-sales interaction” - informs about the ratio of the activity of buying upsells and other types of cross-selling when purchasing goods by customers:
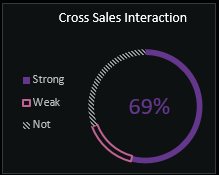
When a customer contacts a store to buy a specific product, sellers offer additional related products. If the customer bought together with the main additionally offered goods - as a result, a cross-sale occurred. In this diagram, you can see the share of all transactions for the whole week with active cross-sales (strong interaction of sellers and goods with customers), passive (weak interaction) or without cross-sales (no interactions).
“Product Groups by Day” is a very informative petal chart (synonymous with a radar chart):
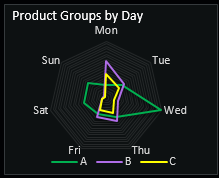
Here you can clearly see the display of sales activity separately for each group of goods on certain days of the current week. One of the favorite data visualizations does not require a lot of description, but with its appearance alone it conveys a lot of semantic information without words.
"Customers: M | F ” - the vertical mirror histogram (synonym for butterfly) on this dashboard displays the ratio of the number of women and men among buyers in each day of the week:

“Supply Delivery Balances” - a combined schedule for analyzing changes in the movement and quantity of goods in warehouses in pieces:
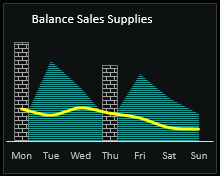
Striped blue mountains are the actual remnants at the current end of the day of the week. Brick pillars - days and volumes of supply of goods. The yellow curve is the volume of daily sales throughout the week.
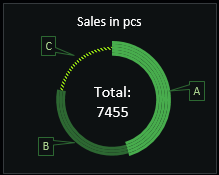
“Sales in units” - a fairly informative chart segments by categories A, B and C the total number of goods sold per week:
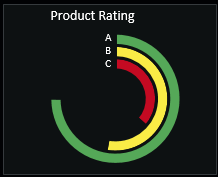
“Product rating” - a sector diagram represents the rating and the ratio of product categories by weekly sales activity:
“Budget load” - a speedometer-type chart represents a visualization of the amount of expenses in relation to the planned budget for the current week:
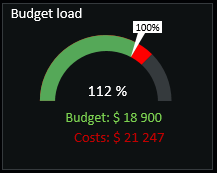
In green, the budget level, and in red, the proportion of expenditures exceeding the amount of the established budget for this week. Throughout the year, daily or weekly and monthly budgets can vary significantly depending on the seasonality of the business. Daily budgets are indicated in the cells of the last column on the “Data” sheet.
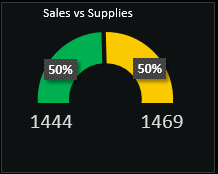
“Sales VS Supplies” - and again a speedometer to control the ratio of the percentage in quantity sold and delivered at the arrival of goods per week:
“Refunds” - the percentage of refunds as a percentage of the total number of goods sold:
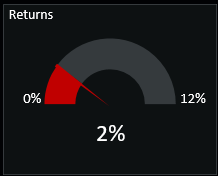
In this example, the maximum allowable share is 12%. This value is set on the “Processing” sheet in cell I40.
Using this library of 13 visualization elements using the designer, you can create your own dashboards for weekly planning reports:
 Download Dashboard Designer in Excel
If necessary, you can independently replace the charts with your own. Just create them in groups and follow the sequence of group names. To manage groups and all figures on the sheet, press ALT + F10. If you need more charts and charts than 13, then edit the dashboard constructor macros in the Visual Basic Editor - ALT + F11.
