Excel CRM Dashboard Template for Small Businesses
In every business, to achieve systematic growth, it is necessary to regularly monitor key performance indicators. The best way to do this is with Pivot charts presented in an understandable format on a single dashboard. Data visualization significantly simplifies the process of making effective business decisions. We offer you a free Excel CRM system template with business process visualization on the dashboard. You can download the ready-made CRM template in Excel format at the end of the article.
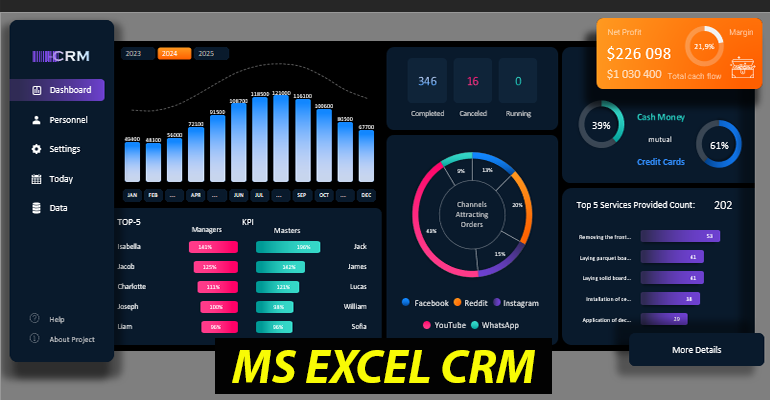
Excel CRM System Presentation with Pivot Charts
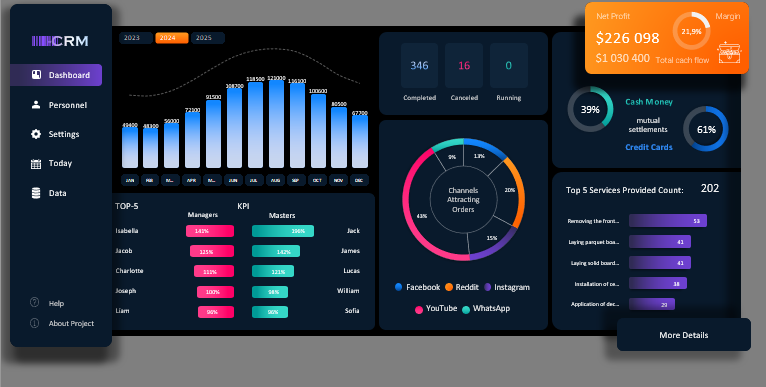
The dashboard allows you to monitor important management indicators by years and months to track the dynamics of their impact on results and observe changes in the frequency of financial flows simultaneously.
The dashboard structure consists of:
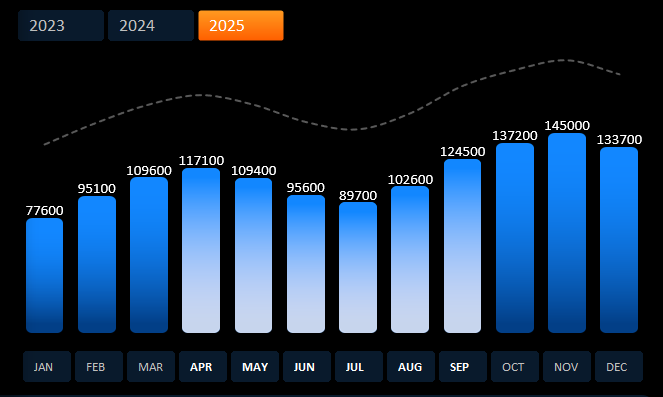
- A block analyzing revenue dynamics for the selected accounting period by years and months.
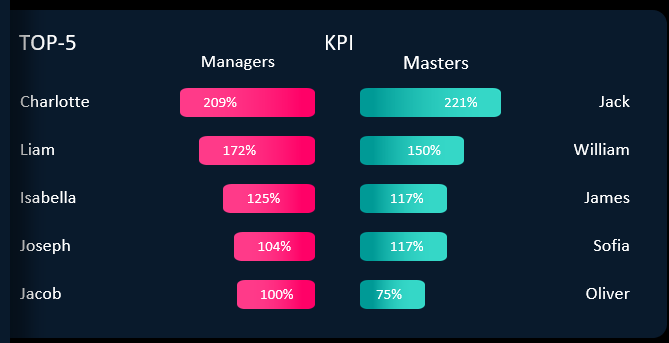
- Key performance indicators for the efficiency of work by masters and managers in meeting their KPIs.
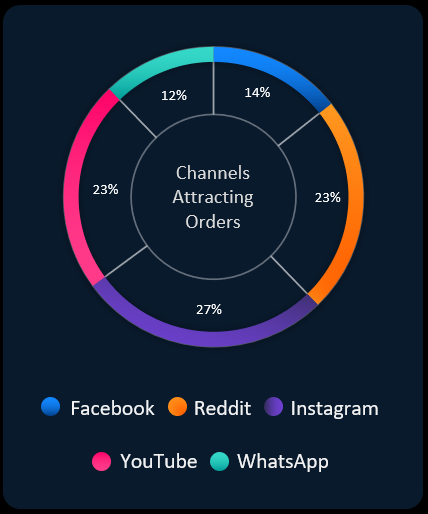
- A Pivot Chart of customer acquisition channel segmentation from different sources.
- A section assessing the shares of cash and non-cash settlements.
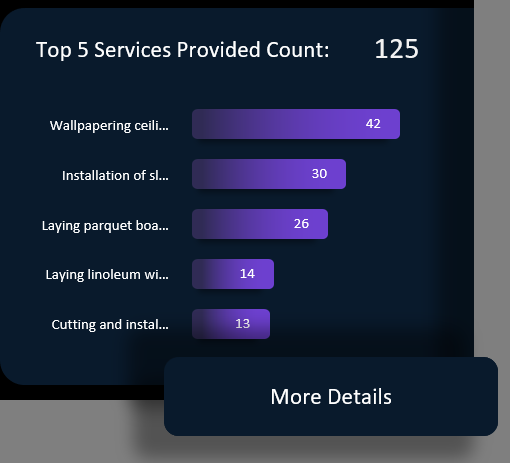
- A ranking of the most sold types of services during a specific seasonal period.
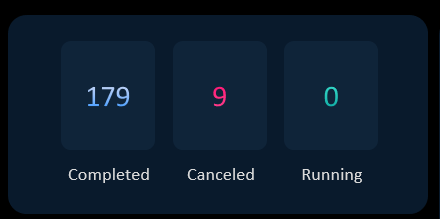
- Concise information about the statistics of order fulfillment statuses (completed, canceled, in progress).
- A Pivot report on the financial indicators of the business.


The dashboard allows you to control the microeconomics of the enterprise and efficiently manage business processes through quick decision-making. For example, here you can monitor the ratio of cash and non-cash payments, as well as track statistics on order status. The Pivot report includes KPI indicators for analyzing the effectiveness of managers and masters' work.
In general, the dashboard succinctly presents Pivot information about the state of the business as a whole for an assessment of the overall picture at the current moment. Separate pages with Pivot charts, tables, and reports are provided for detailed data analysis.
Pay attention to how pivot table slices simplify data filtering and allow interactive management of the dashboard. It is very convenient to use such a technique in Excel.
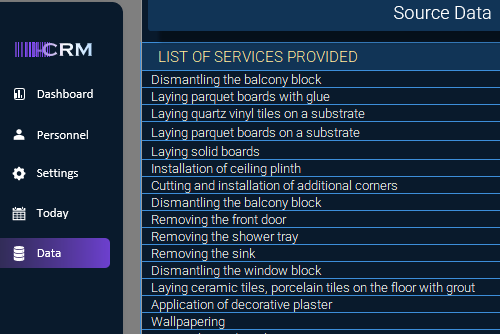
Structure of CRM System in Excel
The entire Excel CRM system development template consists of:
- A dashboard with Pivot charts and data visualization.
- Personnel panel.
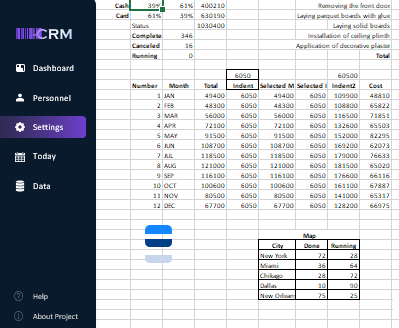
- Formula settings screen for dynamic charts.
- Order tracking with geodata analysis.
- Access screen to the top-level database.
An example of a CRM template in Excel is prepared for small businesses providing repair services.
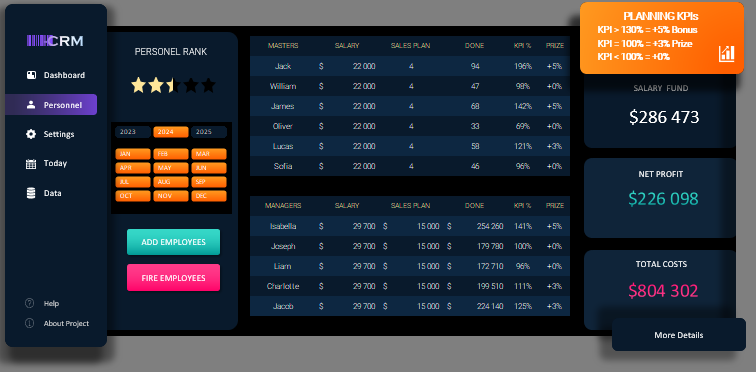
In the "Personnel" section, the main Pivot of the list of active employees is presented:
- Salary amount.
- Monthly plan (for masters, the plan is set by the number of completed orders, and for managers, it is the sales amount).
- Actual monthly figures in amounts, quantities, and percentages.
The star-rated Chart evaluates the overall staff labor level. In this section, all calculations are performed automatically and immediately displayed visually.
The payroll fund depends on employees' plan achievement indicators. Reward conditions are displayed in the orange block in the upper right corner of this section. To manage the conditions, click on it. Clicking on the reward conditions block takes us to the monthly plan setting and reward conditions section. Here, we can observe the history of changes or make adjustments for the current month.
In this section, you can also add new employees or terminate their employment. To add a new employee, click the green "ADD EMPLOYEES" button and go to the form filling screen. This is a template, not a full-fledged application. Developers should add code to it so that, after filling out and confirming the form with the corresponding button, the form field data is registered in the employee database. Then calculations related to this database will be updated automatically.
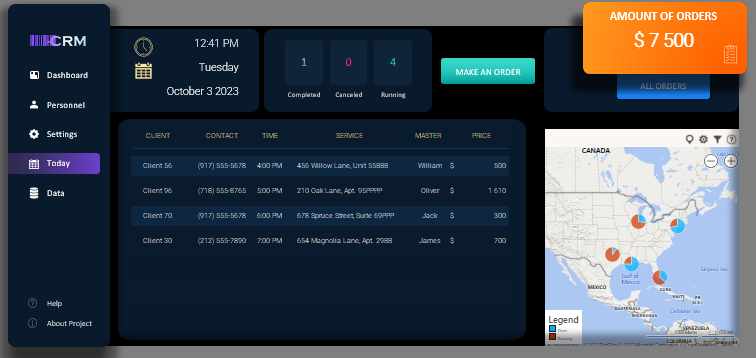
In the "Today" section, there is a brief statistics with indicators for the current working day:
- Number of today's orders (completed, canceled, in progress).
- Planned revenue for the current day.
- Map for tracking the territorial location of order fulfillment.
Pivot table of orders:
- Client name;
- Contact information;
- Order registration time.
In the upper right corner, on the orange block, there is the total amount of orders for today. Clicking on it provides access to all orders in the database for the entire history of the enterprise's activity.
To create a new order, click the green "MAKE AN ORDER" button. First, specify the manager and fill in all the form fields with the respective data.
 Download Excel CRM Dashboard for Small Business