Gap Analysis template Excel with Chart free download
Example of interactive use of data visualization in Excel for presentation and analysis of price gaps between weekly periods. You can download the template at the end of the article. But first familiarize yourself with its principles of operation and use.
Visual analysis of gaps in statistical data on the Excel chart
Financial and economic indicators never move in a linear line. More often than not, the dynamics of changes in their values resembles a roller coaster. Analyzing visual reports on charts, one can observe their statistical movement down, up, slow, fast - always in different ways. Moreover, in contrast to the roller coaster, the value curves on the visualization can contain discontinuities for various reasons. Examples of discontinuities of statistical values on the financial chart of the stock price:
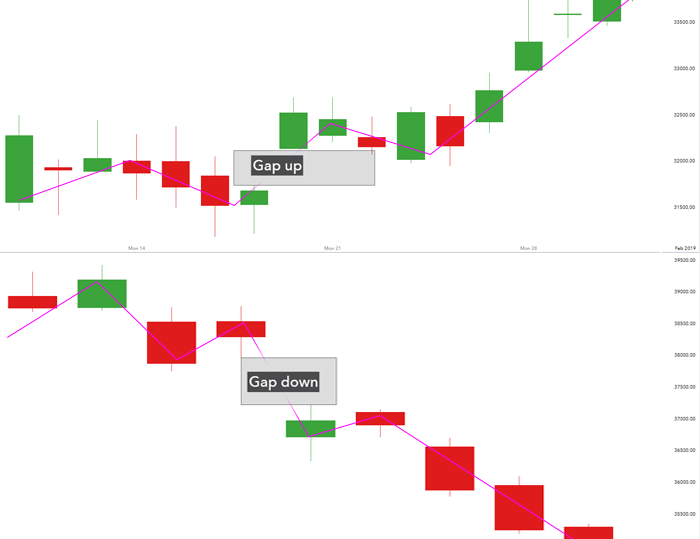
- Gap up - the price of the minimum is higher than the price of the maximum of the previous day.
- Gap down - the price of the maximum is lower than the price of the minimum of the previous day.
In this example, this time we will present several situation models at once for applying the template with data visualization. Immediately 4 models of the situation necessary in the gap analysis of statistical values for the accounting period.
Model 1 stock market chunks break up after the weekend
The investment portfolio contains most of the high-yield stocks with high volatility that are listed on the New York Stock Exchange. But there is a small nuance. The New York Stock Exchange is only open Monday through Friday, and it is closed on the weekend. Nevertheless, most public companies that list their stocks on the NYSE are open on weekends and continue to try to improve their financial and economic performance on those days. Plus the various financial events in the world have no days off and take place whether it's Saturday, Sunday or any other day. And many of the favorable and unfavorable events that occur on weekends have a significant impact on stock prices and securities. The most volatile securities, such as silver futures, are particularly affected. As a result, it is clear to the naked eye in the visualization of the stock price how much different Friday is from Monday. Price gaps of 10%-15% and sometimes even more are not uncommon.
It is necessary to analyze whether there were stock price gaps after the weekend and between what weeks? If so, how significant were they? All in order to determine the factors influencing the rate and their power to control the profitability of the investment portfolio.
Model 2 weekly gaps trading strategy in the forex market
The forex market in most cases has price gaps between weeks at the boundaries of Friday and Monday. Almost every new week begins with a price gap on the chart of the rate of one or another currency pair. The reason is the very nature of the global currency market. The largest international currency market in the world is the FOREX. It operates around the clock in four trading sessions at different times, which overlap each other:
- Pacific session.
- Asian.
- European.
- American.
Forex market works 24 hours a day, every working day of the week except weekends. On weekends the Forex currency exchanges and the market in general are closed, that is 24/5. Along with them, central banks around the world are closed for 2 full days off. And so it is every week. But no one has canceled the interbank market, which continues to work actively on weekends, i.e. 24/7. On Monday, all central banks and the most global Forex market open, and the situation with currency prices has already changed for two whole days. As a result, there is a price gap between Friday's close and Monday's open. Especially large gaps between weeks for very volatile currency pairs, such as GBP/JPY.
The interbank market is much smaller than all central banks and the global Forex market. Therefore, in most cases, these gaps are false and are closed by the force of a fair price. As a result, the price returns to its proper level in the first days of the week. Many traders build very effective trading strategies on this fact. But sometimes the factor influencing the gap could not be the interbank market, but an important economic event, which led to a panic of market participants. Therefore, you need to assess the risks correctly and place orders with the correct Stop Loss and Take Profit orders at the proper levels.
It is necessary to analyze how false and essential is the price gap. And also on what levels of the prices it is better to expose orders Stop Loss and Take Profit for orders on purchase or sale.
Model 3 Cash Gaps
Some businesses do not conduct financial activity on weekends for a variety of reasons: market specifics, a special category of clients (e.g., government agencies), company policy (e.g., some banks do not operate on weekends). As a result, there may be small cash gaps and under-receipt of planned revenues. Or a series of unforeseen cash gaps may unfairly underestimate the sales plan.
It is necessary to determine between which weeks in a month cash gaps are most likely to be expected in order to make fair sales plans.
Model 4 Strategic Gaps
Any long-term financial goal is unattainable without short-term budgets. The financial analyst has no right to rely on random luck, but only facts and strategy! In essence, a strategy is a decomposition of sequential, logical and objectively realizable objectives. That is, when planning a strategy, the global goal is divided into smaller goals, objectives and subtasks. If the sequence is broken, there is a risk of strategy failure on the way to achieving the global goal. The place where the sequence has been disrupted is called the strategic gap. A professional analyst must have the art of planning based on his projections! In practice, no strategy is implemented without strategic gaps, as all sorts of circumstances occur and make adjustments to the short-term plans of the global strategy.
It is necessary to identify strategic gaps and assess the strength of their impact on the medium-term goals and objectives in order to eliminate them in the next stages of achieving the goal. After all, a mistake is just a chance to try again with a new level of experience.
Data visualization structure
You can use the data visualization tools in Excel to work with the analysis of statistical data gaps between weekly periods. This interactive template consists of two visualization blocks and a control panel.
The upper block displays the overall picture for the selected accounting period of 1 year:
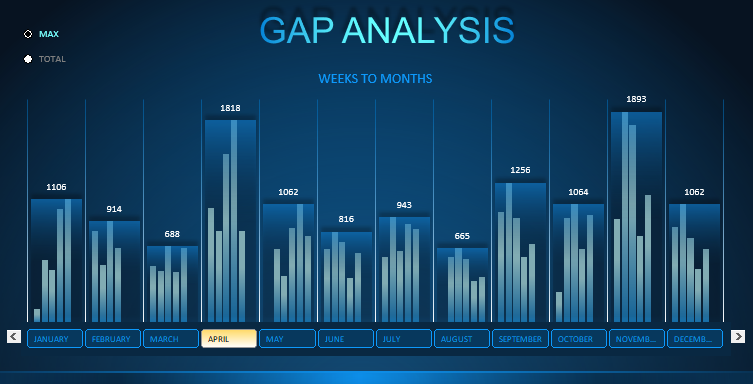
Each bar on the histogram shows the values for the month, formed from a group of columns of values for a weekly period. That is, there are 5-6 weeks in each month (4-5 weeks in February). In the upper left corner there is a switch between displaying the total values for the month:
- MAX - the week with the maximum value in the current month.
- TOTAL - the sum of all week values for the current month.
Below the block is a control panel of twelve buttons for switching between months on the lower block. And two buttons on the edges for scrolling the lower block for easy visual analysis of the weekly gaps located at the borders between the end and beginning of months.
The bottom block has only one control to turn on and off the display of pink blocks at the gaps:
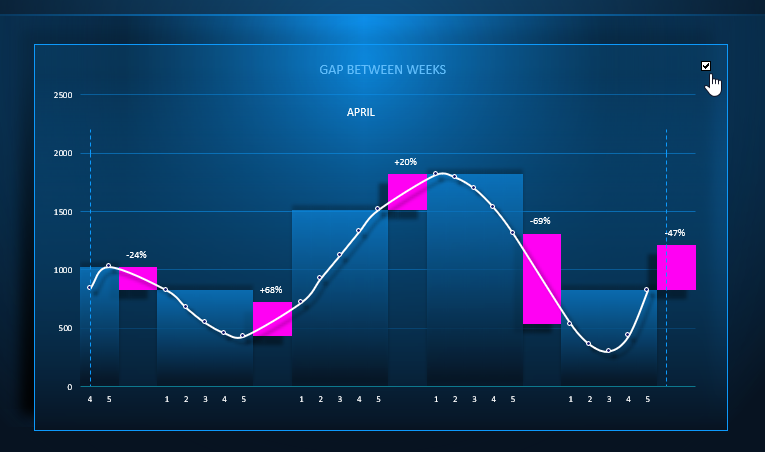
The size of the pink break block visually displays its approximate size. And above the block the price displacement at the gap in percent is indicated. If the gap is down, the value is negative with a (-) sign, and if it is up, it is positive with a (+) sign.
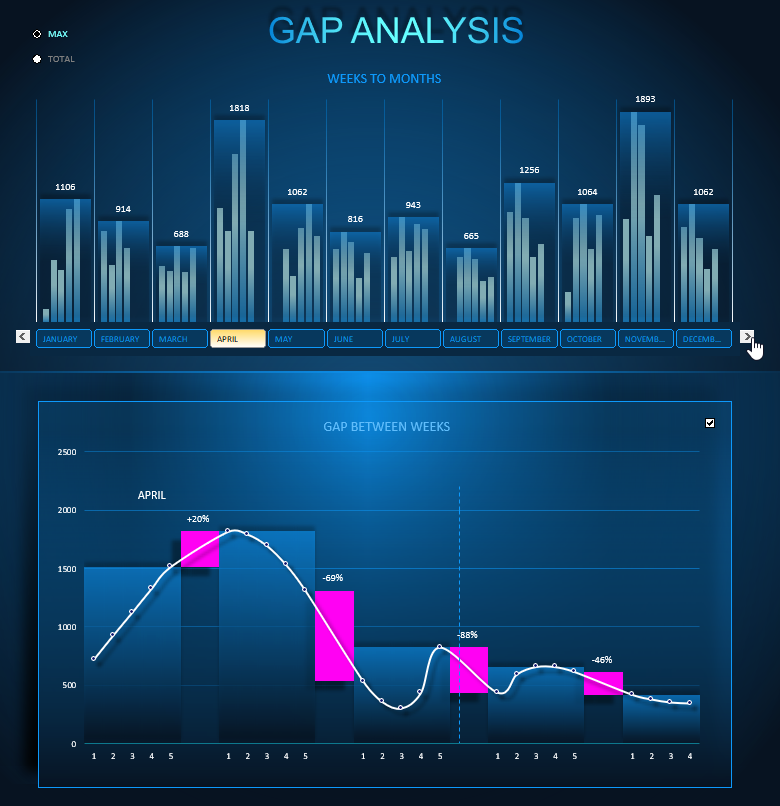
Using the arrow buttons for scrolling, you can scroll through the chart on the lower visualization block, and the vertical dashed line indicates the end/beginning month boundary:
 Gaps analysis example report download Excel template
Fill in your raw data on the "Data" sheet in the first two columns of the range A3:B367. The cells in this range are highlighted with a border, a black line. The other cells on this sheet are filled with formulas. This template contains no macros and is free to use. It is easy to modify it to suit your specific tasks and needs.
