How to calculate percentage distribution in Excel with a formula
Percentage distribution shows us how a specific value (e.g., total income) is divided into individual components that make up its entirety.
Formula for Percentage Distribution in Excel
As seen in the image below, the formula for calculating percentage distribution in Excel is very simple:
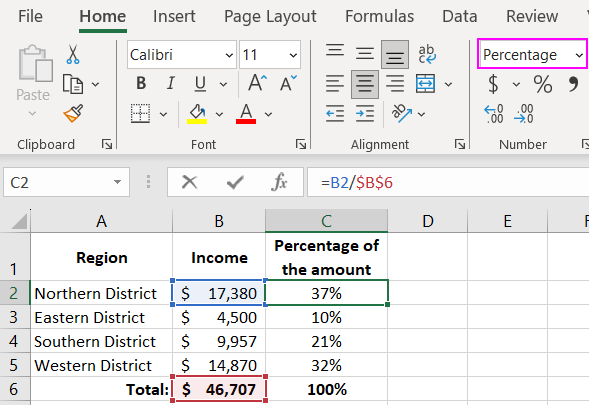
Each part needs to be divided by the sum of all parts. In this case, cell B7 contains the value of the total income of all departments in the regions. To calculate the percentage distribution of total income across all regions, it is enough to divide the value of each individual indicator for each region by the total income.
As you can see, the formula is not very complicated. It simply uses relative references to the incomes of the regions to divide them by an absolute reference to the total income. Note the absolute reference. The dollar signs allow locking the reference to a specific cell. Thanks to this, the address of the absolute reference does not change when copying the formula to other cells.
Percentage Distribution Using a Dynamic Excel Formula
A separate calculation to store total income in a separate cell as a constant is not necessary. If we add the =SUM() function to the formula, then we can dynamically perform the calculation of percentage distribution. The image below shows the solution for creating a dynamic formula for the percentage distribution of individual values.
=B2/SUM($B$2:$B$5)
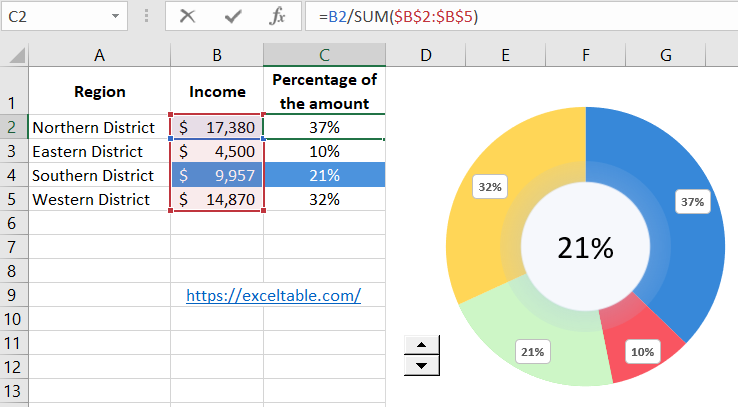
Note: For those unfamiliar – the SUM function adds up all the values specified in its arguments.
 Download
Again, note that all the addresses of the links specified in the arguments of the SUM function must be absolute (in this case). Thanks to the fixed absolute references in the argument of the SUM function, the range of cells will not change during the copying of the formula to other cells.
