Accounts Receivable to Accounts Payable Ratio in Excel
The debtor's debt reflects the amount owed by third parties and organizations to our company. These are funds that the firm expects to receive within a specified period for goods shipped, services rendered, money from accountable individuals, borrowers, etc. Creditor debt refers to our obligations to individuals or legal entities. This includes outstanding amounts to suppliers, unpaid taxes, insurance premiums, accrued but unpaid salaries, etc.
The overall debtor-to-creditor debt ratio indicates how much debtor debt covers creditor debt. In other words, it tells us how many dollars of debtor debt correspond to one dollar of creditor debt.
Formula for the Debtor and Creditor Debt Ratio
Many analysts believe that debtor and creditor debts should be comparable, and their growth rates should be similar. This is the optimal scenario.
A company should settle its creditor debt irrespective of the magnitude of its debtor debt. Therefore, when the former exceeds the latter, it's inappropriate to talk about rational use of funds. A significant increase in debtor debt risks financial instability (funds are moving out of the economic circulation); seeking additional financing sources becomes necessary to repay loans.
Normative Values
Calculating the debtor and creditor debt ratio allows us to find the optimal relationship between these figures. Ideally, the value should range between 0.9 – 1.0, meaning that creditor debt shouldn't exceed debtor debt by more than 10%.
Formula for the coefficient:
Debtor to Creditor Debt Ratio = Debtor Amount / Creditor Amount
Formula based on the balance sheet:
Debtor to Creditor Debt Ratio = code 1230 / code 1520
Calculating the Ratio in Excel
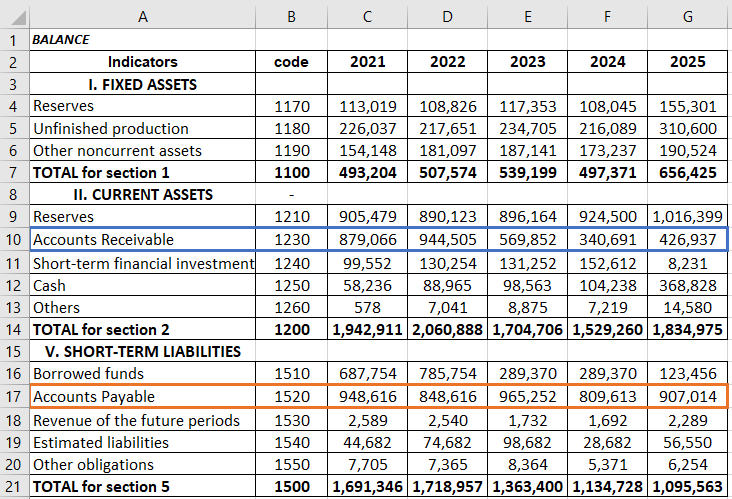
Let's consider the ratio for the company "XDAO" as an example.
Balance sheet data for the last 5 years:
Let's visualize the changes in the values from 2021 to 2025:
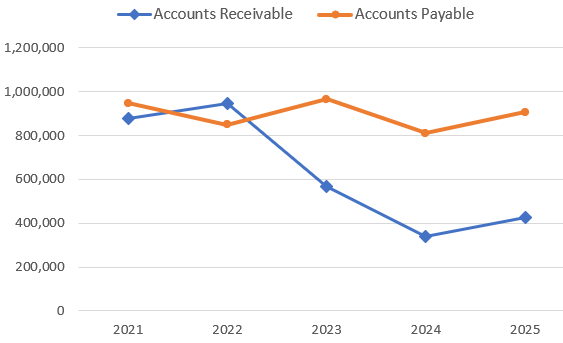
Debtor debt decreased over the analyzed years, notably at the end of 2022. Conversely, creditor debt also decreased. The difference between 2021 and 2025 was 41,602. A significant reduction in the debt amount occurred at the end of 2023.
We'll calculate the debtor and creditor debt ratio using cell references in the formula:
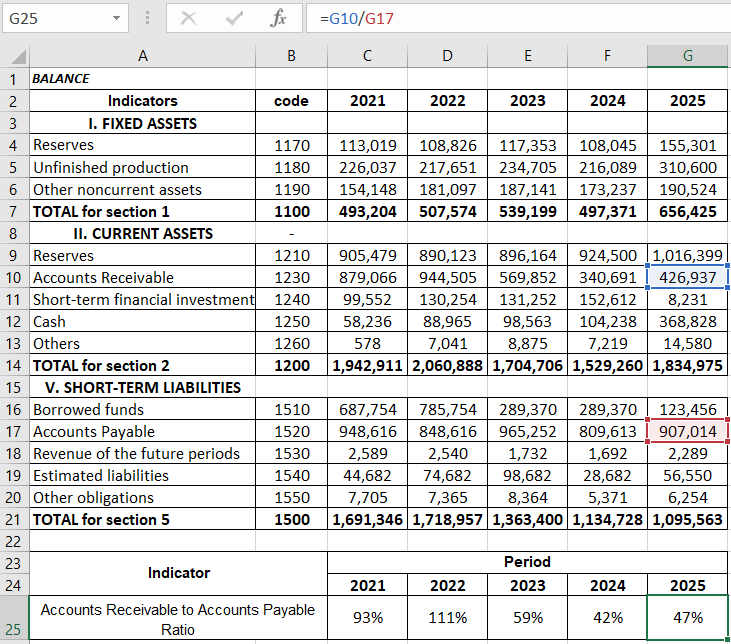
From the table, the ratio decreased to 0.4707 in 2025 compared to the beginning of the period, indicating an unoptimal ratio. Creditor debt surpassing debtor debt signals inefficient fund usage and inadequate enterprise solvency.
Visual representation of the ratio's change:
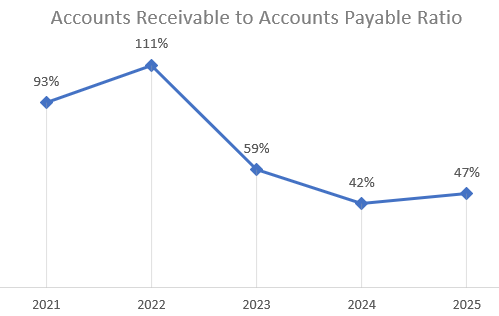
The optimal ratio was observed in 2021 and 2022.
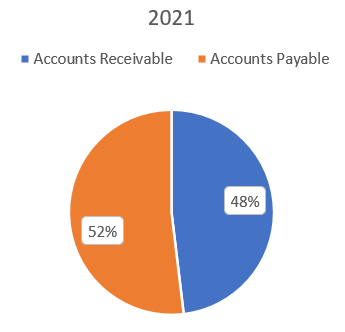
Let's represent the ratio between the metrics year by year using a pie chart, labeling the data percentages.
Comparison result for 2021:
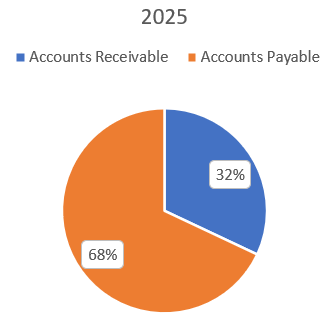
Here's the ratio for 2025:
 Download example of calculating Debtor and Creditor Debt Ratio in Excel
Creditor debt exceeds debtor debt by 36% (against the recommended 10%). The ratio changed by 0.46 during the analyzed period, mainly due to the relative stability of creditor debt and the decrease in debtor debt.
