Economic Efficiency Coefficient of Company in Excel
To evaluate the financial and economic activities of an organization, such reporting forms as Balance Sheet, Profit and Loss Statement, and Cash Flow Statement are compiled. These forms are prepared in absolute values. Economic indicators are used to assess economic efficiency. Let's calculate the main financial ratios using Excel tools.
Profitability Analysis
To calculate the economic efficiency ratios of a company in Excel, we use conditional data that characterize its economic activity.
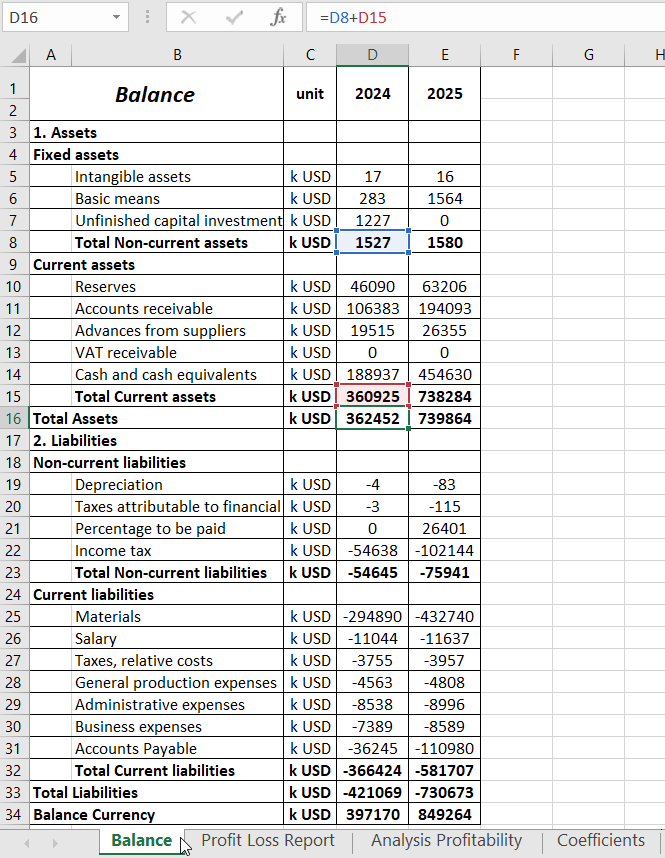
We have a balance sheet:
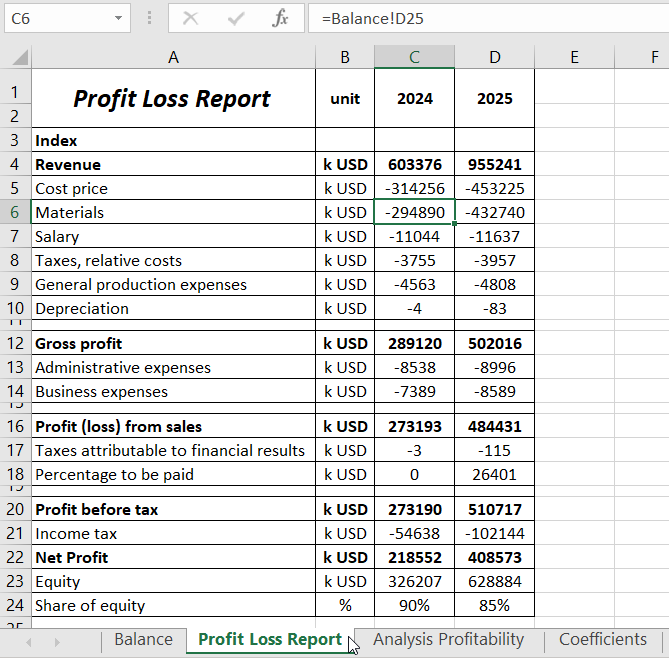
Profit and Loss Statement with data for 2 years:
We will calculate the efficiency ratios of the company's operations.
Gross Profit Margin is a profitability indicator that reflects the percentage share of profit in sales. It is calculated as the ratio of gross profit to revenue. It also indicates whether the company can reduce prices in response to changing market conditions compared to competitors. In financial analysis, it is used in conjunction with the operating profit margin before tax obligations.
For clarity, let's transfer the necessary data for calculating the gross profit margin to the "Profitability Analysis" table:
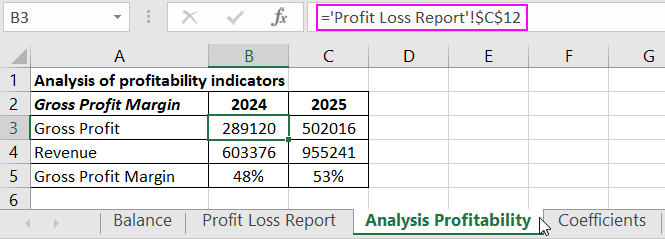
References to corresponding cells in the Profit and Loss Statement are used.
Formula for calculating Gross Profit Margin:
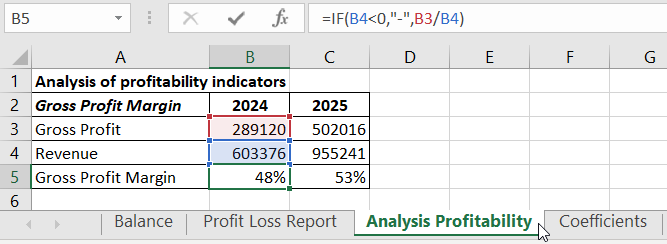
* Percentage format is set for result cells.
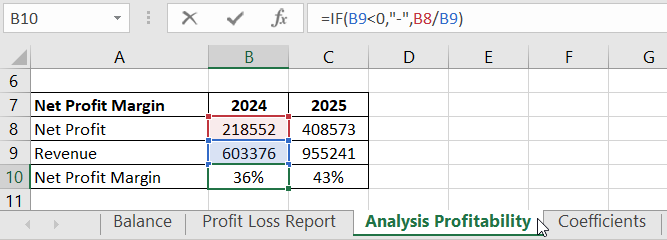
Net Profit Margin compares net profit to revenue, indicating the efficiency level of the company's operations.
Let's transfer the necessary data from the Statement to calculate the net profit margin:
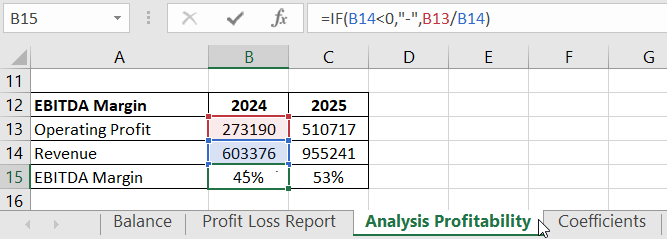
Operating profit margin before tax (EBIT margin) shows the relationship between operating profit and revenue, indicating how profitability depends on sales volume.
Calculation in Excel:
Asset Efficiency compares net profit to total assets, indicating how efficiently the company's assets are utilized.
Let's calculate in Excel:
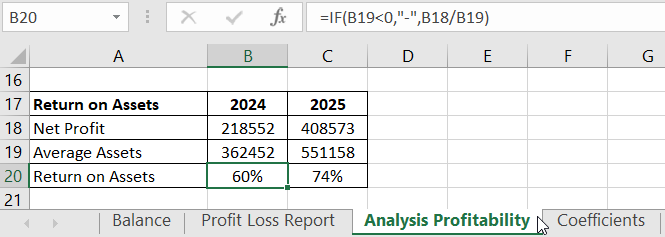
For calculating average assets, data from the balance sheet ("Total Assets" line) is taken. It's necessary to find the average value at the beginning and end of the period ((beginning figure + end figure) /2).
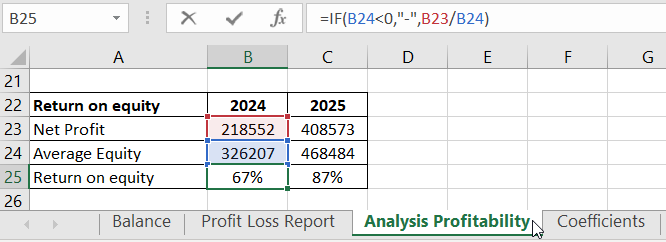
Return on Equity compares net profit to the average equity, illustrating the efficiency of capital usage.
Data and formula for calculation:
These are the main economic efficiency ratios of the company.
Liquidity and Financial Stability Analysis
In a market economy, financial resources of the company play a crucial role. Various methods are used to assess their effective use (calculation of profitability ratios, financial coefficient analysis, valuation of capital structure and movement). Let's use the financial coefficient analysis method.
Efficiency of resource usage is characterized by financial stability, solvency, asset turnover, and capital ratios.
Financial stability assessment ratios:
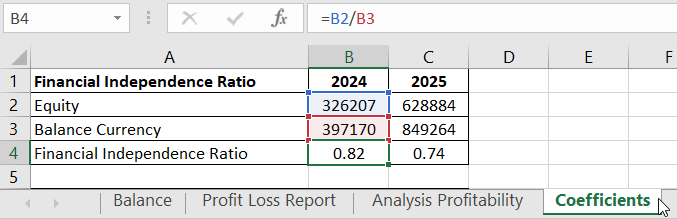
- Financial Independence Ratio (standard - >=0.5). Formula: Equity / Balance Currency.
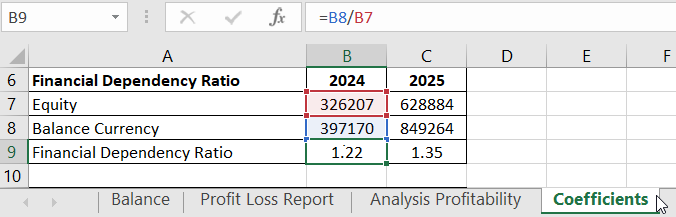
- Financial Dependence Ratio (standard - <=2.0). Formula: Balance Currency / Equity.
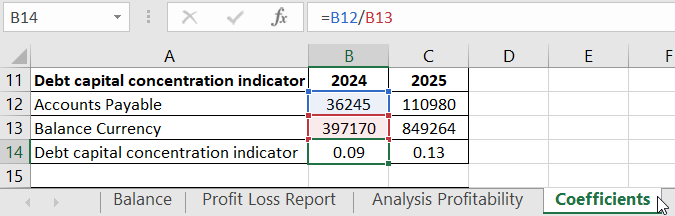
- Loan Capital Concentration Ratio (standard - <=0.5). Formula: Loan Capital / Balance Currency.
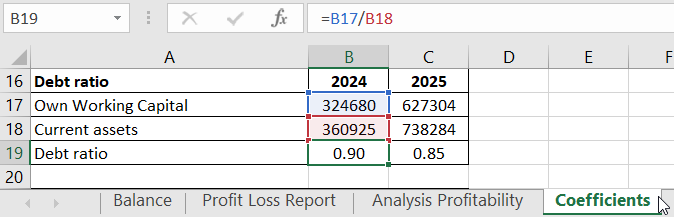
- Debt Ratio (standard - <=1.0). Formula: Equity Working Capital / Current Assets.
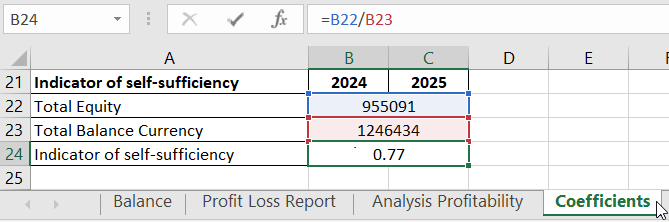
- Self-funding Indicator (standard - >=0.1).
 Download an example of calculating the Company's Economic Efficiency Coefficient in Excel
Analysis of efficiency ratios of financial resource utilization is carried out dynamically. Indicators are compared with recommended values and data from other organizations operating in related fields.
Liquidity, as an indicator, characterizes the ability of the company to cover necessary expenses. Ratio calculation involves comparing current assets with short-term liabilities.
- Absolute Liquidity Ratio (relation of cash and short-term investments to current liabilities). The amount of cash does not cover short-term obligations.
- Short-term Liquidity Ratio (relation of highly liquid assets to current liabilities). The company cannot quickly settle short-term obligations with current assets.
This is one of the most stringent evaluations of the company's liquidity.
