How to Calculate Accounts Payable Turnover Ratio in Excel
The accounts payable turnover ratio reflects how quickly a company pays off its debts. In international standards, it is known as the Accounts payable turnover ratio. This metric is commonly analyzed alongside the accounts receivable turnover ratio and is used by internal company services, potential creditors, and investors.
Economic Meaning and Normative Value
The accounts payable turnover ratio indicates the number of times a firm has settled its debts with creditors within the analyzed period, be it annually, quarterly, or monthly.
Assessing this ratio indirectly highlights a company's liquidity and solvency. Primarily, it is associated with credit risk. A higher ratio implies that the company settles its debts faster, indicating greater solvency.
The company may have accounts payable to suppliers for materials necessary for production and sales, to the state, its own employees, and other businesses.
There isn't a specific normative value for the turnover ratio. However, a higher value generally indicates better liquidity. Nonetheless, excessively high values can decrease profitability, which is not ideal.
It's common to evaluate both accounts payable and accounts receivable turnover ratios. Ideally, the former should be higher than the latter, indicating increased company profitability and more available funds for business operations.
Accounts Payable Turnover Ratio: Balance Sheet Formula
To calculate this metric, you can use the following formula:
Accounts Payable Turnover Ratio = Revenue for the analyzed period / Average accounts payable.
The average is determined by dividing the sum of all accounts payable at the beginning and end of the period by 2.
Substitute the appropriate lines from the financial statements into the formula:
Accounts Payable Turnover Ratio = code 2110 / (code 1520beginning + code 1520end) * 0.5.
The numerator is sourced from the income statement, while the denominator comes from the balance sheet.
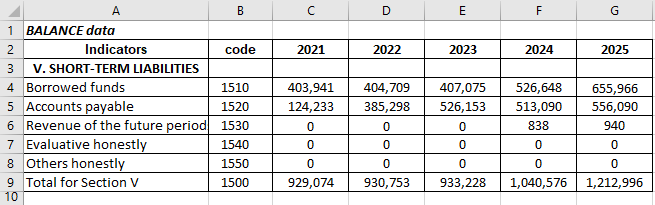
Required data from the balance sheet (form filled out in Excel):
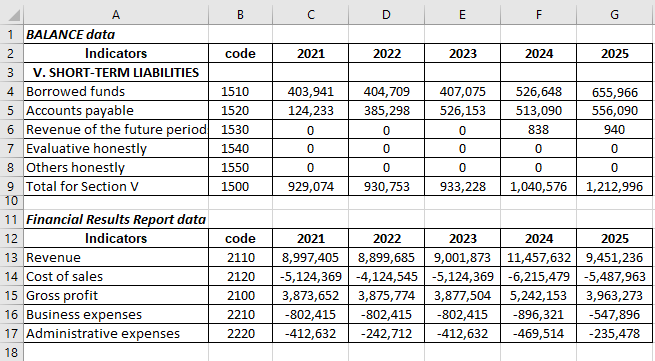
Relevant figures from the income statement:
Create a table on a separate sheet for the calculation. Insert cell references with the corresponding data into the formula:
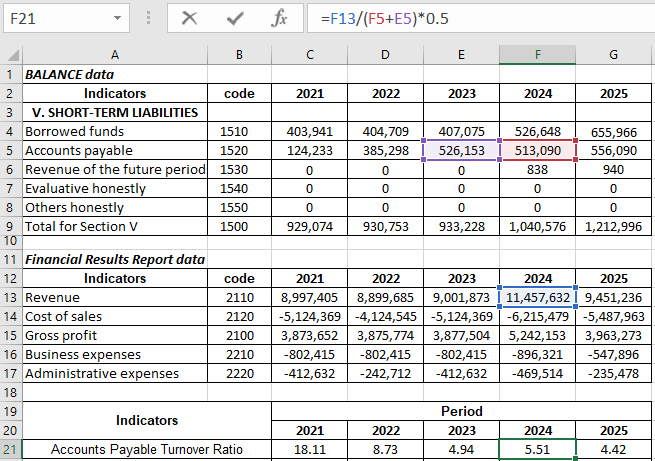
Figures for 2021 and 2022 are arbitrary.
Now, let's calculate the accounts payable turnover ratio in days. This conversion reflects the average number of days needed by the company to settle its debts:
The conversion formula is as follows:
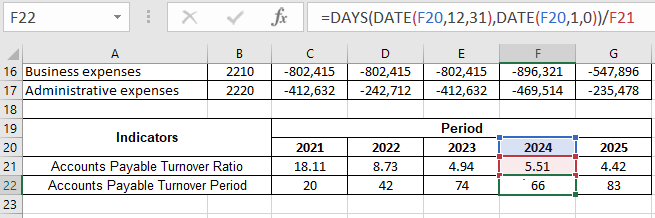
What do these numbers mean? For instance, in 2022, the average duration of one accounts payable turnover was 42 days. This implies that the company takes approximately 42 days to settle its debts.
For a clearer analysis of the trend, we can represent it graphically:
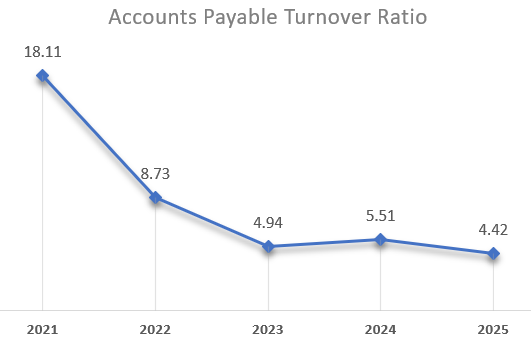
The highest liquidity of the company during the analyzed period was in 2021, as the debt settlement speed (compared to 2025) was nearly three times faster.
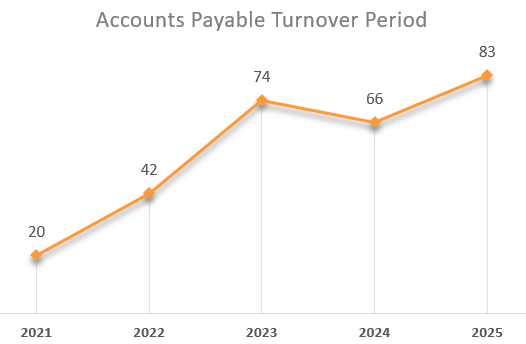
Display the turnover period on a graph:
 Download an example of how to calculate Accounts Payable Turnover Ratio in Excel
The longest period for settling accounts payable was 83 days in 2025. This could indicate:
- The company might be facing challenges in product sales and revenue collection.
- Increased tax burdens, mandatory payments to the budget, etc.
For a more accurate diagnosis of problems, other business activity metrics should be calculated and reviewed.
