Personal financial planning Dashboard template on Excel sheets
Everyone who uses money should keep track of their personal finances. You don't necessarily have to be biased about it, but it's essential to control your major regular expenses. Many people understand this, but most often ignore tracking their own financial resources. There are many programs for automating financial tracking with various report generation features. However, a crucial condition should be the visualization of statistical data on personal expenses. It motivates users to keep track by providing a graphical representation of data in a gamified manner. For example, let's consider a conceptual Excel template with graphs for visualizing reports on personal income and expenses.
An Example template for personal finance accounting in Excel
Beginner home accountants and auditors are recommended to start keeping track of the family budget not in its entirety but partially. In other words, first, learn to control the most essential regular incomes and expenses, and then gradually delve into all the intricacies of personal financial flows. If money is not counted, it means you don't have them!
For inspiration, we recommend considering a dashboard template for analyzing your own financial resources. Perhaps, you will find ideas that fit your unique financial portfolio and personal circumstances.
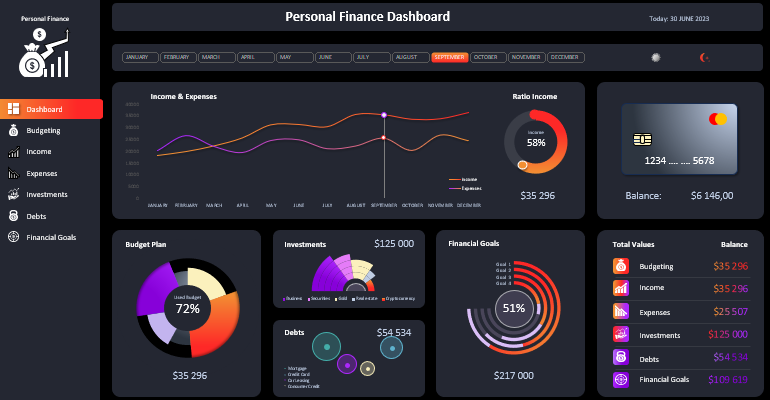
Tracking Personal Finance Expenses in Excel
The overall structure of the dashboard is multi-layered and includes sub-mini-dashboards for detailed analysis of individual income and expense categories. Therefore, the template allows you to view your current financial position as both a comprehensive picture and detailed information about some important indicators.
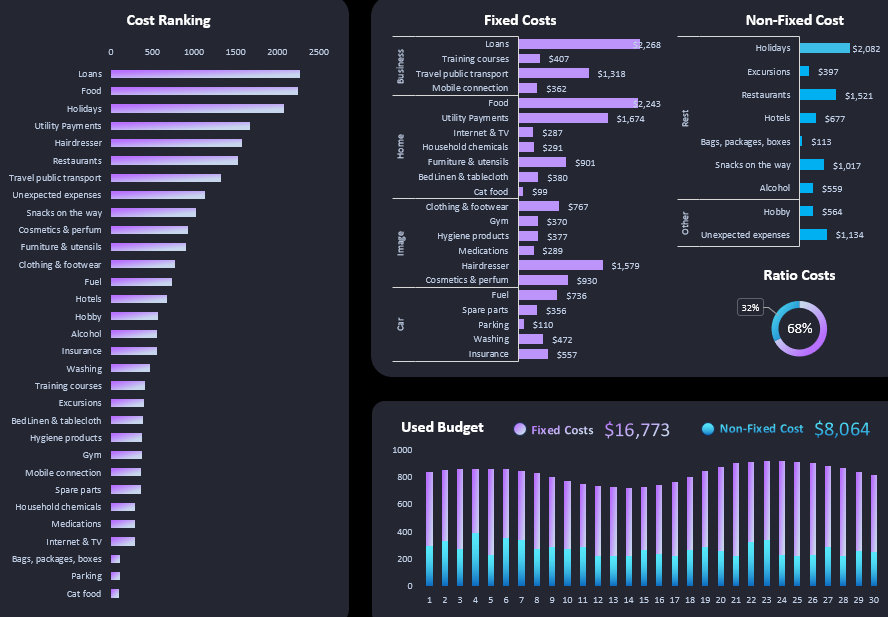
The Most Important Expense Tracking
Especially for you, we have compiled a list of over 30 possible expense categories that 99% of family budgets should consider. You can use these ideas to quickly create your unique list of expense categories or, at the very least, you should know your annual expense levels for each category. On the sub-mini-dashboard, they are conditionally divided into fixed and variable expenses.
List of basic fixed family budget expenses:
- Loans
- Training courses
- Travel public transport
- Mobile connection
- Food
- Utility Payments
- Internet & TV
- Household chemicals
- Furniture & utensils
- Bed Linen & tablecloth
- Cat food
- Clothing & footwear
- Gym
- Hygiene products
- Medications
- Hairdresser
- Cosmetics & perfume
- Fuel
- Spare parts
- Parking
- Washing
- Insurance
List of personal financial expenses:
- Holidays
- Excursions
- Restaurants
- Hotels
- Bags, packages, boxes
- Snacks on the way
- Alcohol
- Hobby
- Unexpected expenses
Here you can also assess their overall level as a percentage. The ranking, sorted in descending order, helps identify the most significant of possible personal financial expenses.
Mini-Dashboard for Managing Personal Income in Excel
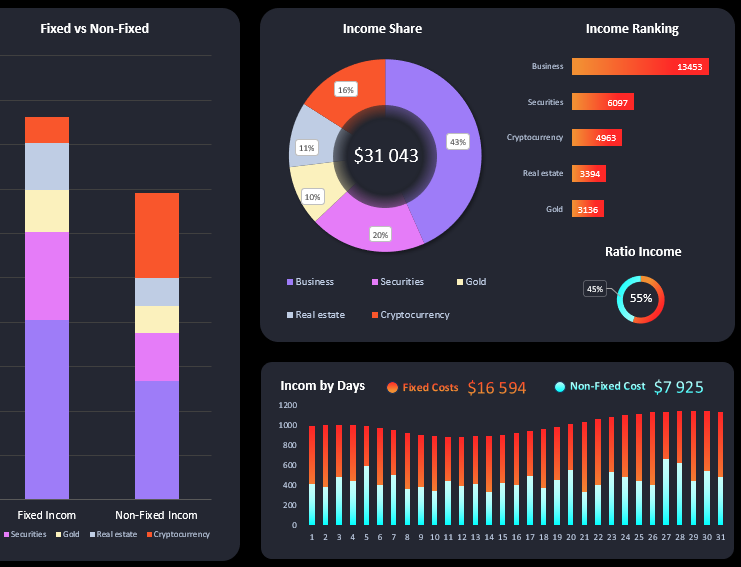
In this section, a comparison of fixed and variable income sources occurs in the large left vertical block. The histogram is also divided into types of assets that generate income. Some may fall into both categories. For example, gold can be an asset with a fixed income like a deposit. Gold can also provide irregular income through trading futures or options on gold XAU/USD.
In the upper right corner, the ranking of the most profitable sources is displayed. The histogram is sorted in descending order.
In this same mini-dashboard, all income sources are segmented into the share of financial inflows into the family budget. In the lower right corner, the overall ratio of volume for all fixed and variable income is shown.
At the bottom is a block for detailed daily comparisons of fixed and variable income levels.
Visualization of Personal Finance Budgeting Data in Excel
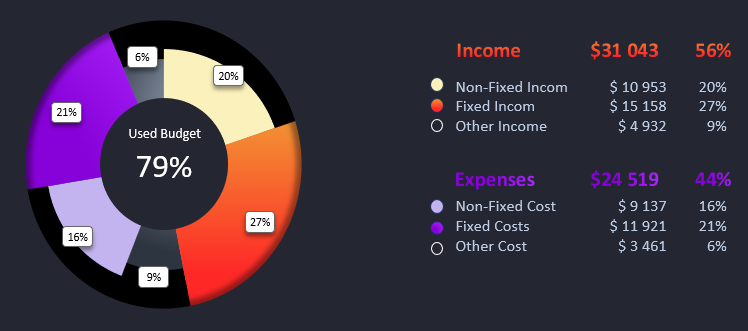
In the personal finance budgeting section, a two-level chart shows the distribution of income and expenses:
- On the first visual level, we see the overall picture.
- On the second visual level, we see the segmentation of ratios for fixed and variable income and expenses.
The table on the right provides their indicators in absolute monetary terms and as a percentage.
Analysis of Savings and Investments in Excel
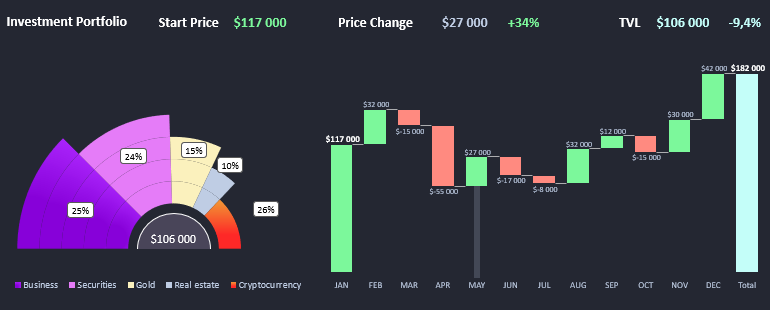
In the investment section, we analyze one of the most important sources of income.
In the left part, the distribution of the total investment volume into various shares of capital invested in different types of financial assets is presented. In other words, it shows how and from what the $106,000 investment portfolio was formed.
In the right part, we track the history of changes in the balance of the investment portfolio concerning the financial market situation.
If you click on the name of the month, the numerical values of financial indicators on the header of the child mini-dashboard for the selected month will be updated accordingly.
Debt Management Report Presentation in Excel
Modern personal finance applications should focus more on analyzing debt obligations and loans. This is what every home accountant should learn to manage in the first place.
This mini-dashboard presents 4 types of loans:
- Mortgage.
- Credit card.
- Car leasing.
- Consumer credit for household goods.
The right part shows the ratio of interest rates on loans (X-axis) to amounts owed (Y-axis).
In the right part, a chart shows the distribution of the total debt (-$75,693), segmented into the shares of types of loans.
Setting Personal Financial Goals in Excel
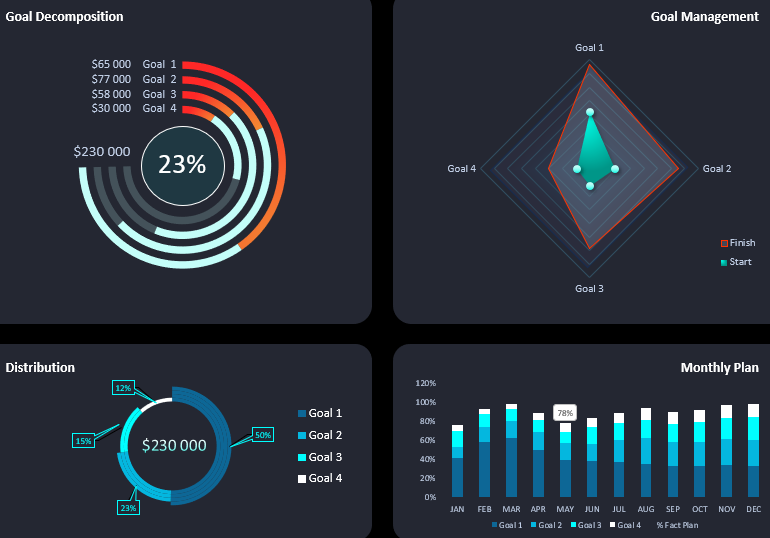
Analysis of personal financial goal achievement is another very important section that every personal finance application should consider.
This child dashboard presents 4 financial goals with different planned budgets:
- $65,000;
- $77,000;
- $58,000;
- $30,000;
When switching by months on the control panel, we can track how personal financial goals were achieved through the charts.
In the first block, Goal Decomposition displays the level of achievement separately for each goal, much like sprinter tracks. In the center, the current plan completion percentage is shown.
In the Goal Management block, we can compare the final levels and current positions on the way to them.
In the Distribution block, the total achievement volume of $230,000 is simply divided into the shares of each goal for analysis in percentage terms.
In the Monthly Plan block, the detailed history of daily progress for each intermediate plan is shown.
Financial Analysis Personal Finance in Excel
The final indicators of all child dashboards harmoniously merge into summary charts on the main page of the final dashboard:
 Download a personal finance template in Excel
Don't neglect managing your personal finances. Money is an integral part of our lives, and we need to learn how to handle it independently. Using this template in Excel, you can create your own unique application that will perfectly describe your current financial situation, tailored to your specific circumstances.
