Fitness calendar with weather analysis download template in Excel
The weather has a major impact on exercise, diet, and daily routines. For fitness workouts to effectively yield results without compromising health, the weather factor should be considered by fitness enthusiasts and professional athletes alike.
Unfortunately, out of the great abundance of apps for fitness trackers today, there are still no software solutions to track and analyze the degree of influence of the weather on workouts. Therefore, here is an alternative fit-tech solution in Excel format. A simple dashboard with fitness calendar and weather can be downloaded at the end of the article.
Example of using the fitness calendar with weather analysis
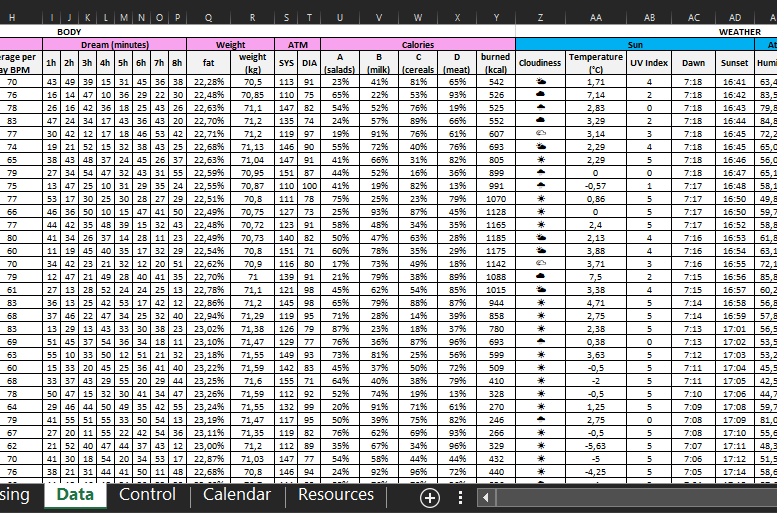
Let's simulate the situation to illustrate a practical example of using a dashboard for fitness in Excel. Let's assume that a certain group of exercises is planned for today, but on this day the weather conditions have changed significantly. The fitness bracelet has recorded body condition indicators under the workout load. These body condition statistics must be entered as initial values on the "Date" sheet in the "BODY" column category of the table, and in the "WEATHER" category we specify the current weather readings for the previous day:
After that we do a detailed analysis on the dashboard to optimize the training program for specific weather conditions. This should be an interesting idea for app developers in the field of fitness technology.
This Excel template allows you to analyze the effects of weather on the body's performance during the active phase of the workout and on recovery mode. These metrics significantly affect:
achievement results;
effectiveness of exercise groups;
the quality of recovery of the body;
the safety level of cardio and strength training.
Visualization of data for the analysis of body condition indicators under physical loads of the body under different weather conditions:
- Minimum and maximum heart rate.
- Average heart rate throughout the day.
- Depth and quality of sleep by minutes over an 8-hour period.
- Dynamics of change and correlation of body weight in relation to percent body fat.
- Mean daily arterial and cardiovascular dystonic blood pressure.
- Analysis of caloric intake by four food groups (A-salads, B-grains, C-dairy, D-meat).
- Dynamics of daily calorie burn over a month.
Based on weather indicators, the standard set:
- air temperature;
- cloudiness;
- atmospheric pressure;
- solar radiation activity "UV-index";
- duration of daylight hours;
- air humidity;
- wind speed and direction.
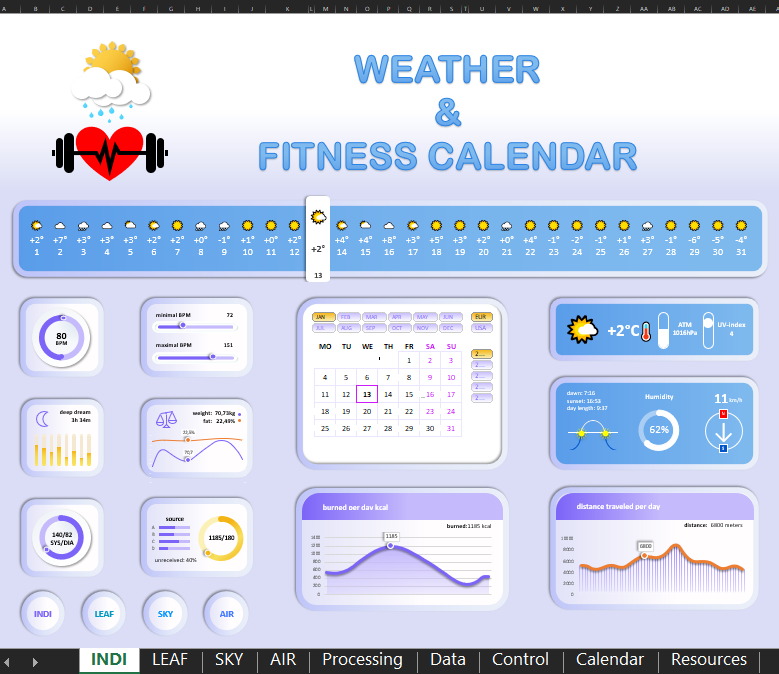
In the center of the dashboard there is an interactive calendar, which serves as a control panel for selecting indicators from the common database.
Description of all the visualization elements in the Excel dashboard
The topmost visualization element is a broad summary panel with basic weather information for only two indicators "cloudiness" and "air temperature". But simultaneously for all days during the selected month:
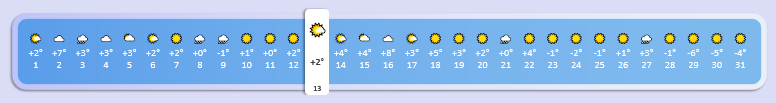
Such a panel allows you to display a general picture to easily and quickly find the day to which you should pay special attention when analyzing the effects of weather on the body. For example, a day with weather anomalies.
In the center of the dashboard is an interactive calendar as a control element for sampling data for subsequent visualization:
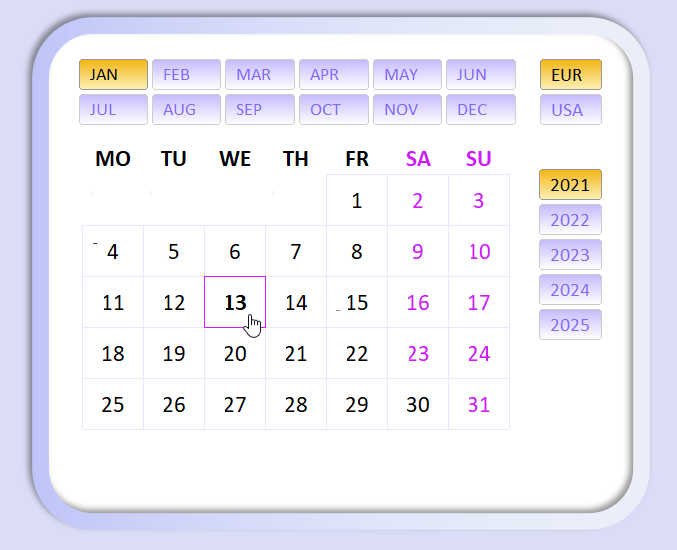
The control buttons on the calendar are divided into 4 groups:
- Selection by year.
- Selection by months.
- Select the desired date for weather and body data analysis.
- Switches between the calendar display formats and some units of measurement for the European region or the United States, specifically:
- temperature display format - Celsius / Fahrenheit;
- wind speed kilometers per hour / miles per hour;
- the first day of the week on the calendar "Monday" / "Sunday".
The visualization block groups are further divided into two parts: the body indicators on the left and the weather indicators on the right.
The first body condition indicator is the average daily heart rate (BPM) value:
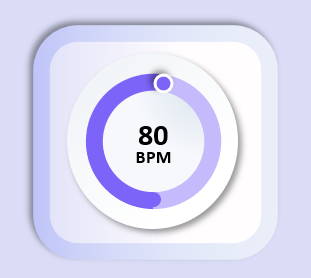
On the diagram you can see at what level the average daily heart rate is.
Next to it is a block of visual comparative analysis of the maximum and minimum number of heart beats per minute during the current day:
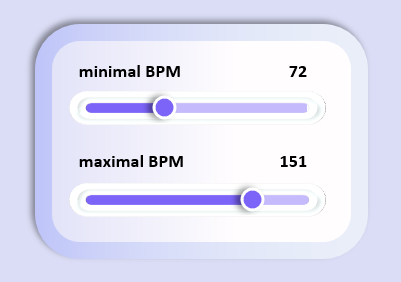
This block has only two values, which can tell you a lot about physical exertion in 1 day. You should pay attention not only to the range of difference between the minimum and maximum, but also to the value of their values. For example, a high minimum does not allow the body to recover fully. As a consequence there can be bad sleep, etc.
The next block is a brief analysis of the quality of 8-hour sleep:
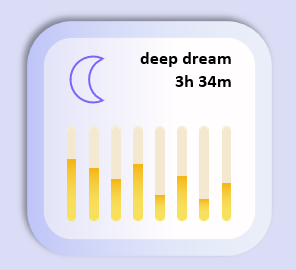
The bar graph shows the proportion of minutes of deep sleep for each hour, and the dial shows the total duration of deep sleep.
Nearby is an informative block of correlation between the percentage of body fat and total body weight:
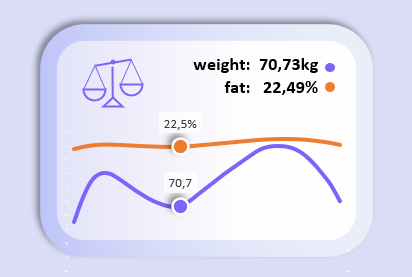
Also a very informative chart. For example, if the percentage of fat decreases along with the decrease in body weight, then the caloric deficit in the diet has more of an effect on fat burning than physical training. If, on the other hand, if fat is being burned actively and body weight is not decreasing or even increasing, it means that the athlete is exercising vigorously on strength training.
The block in the lower left corner is very concise, simple and straightforward, the values of the difference in systolic and diatonic pressure in the cardiovascular system:
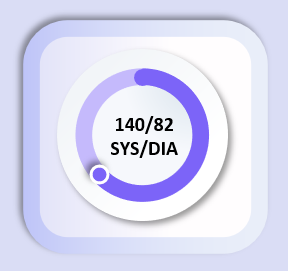
The diagram shows the ratio of SYS and DIA values. It is worth noting that professional athletes very often have simultaneously low systolic and high diatonic heart pressure.
Next to it is the block of calorie consumption analysis:
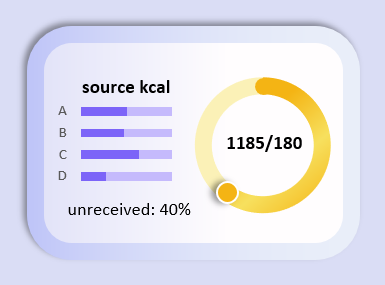
The linear histogram shows the proportions of prevalence of calorie sources for the four baseline groups:
- A - salads, plant foods, and legumes.
- B - cereal products - porridge, bread, etc.
- C - dairy foods.
- D - meat dishes.
The chart informatively shows the number of calories not consumed from the daily maximum (e.g., 1,800) due to adhering to the diet.
The large block in the bottom center presents the dynamics of daily calorie burn for the current month:
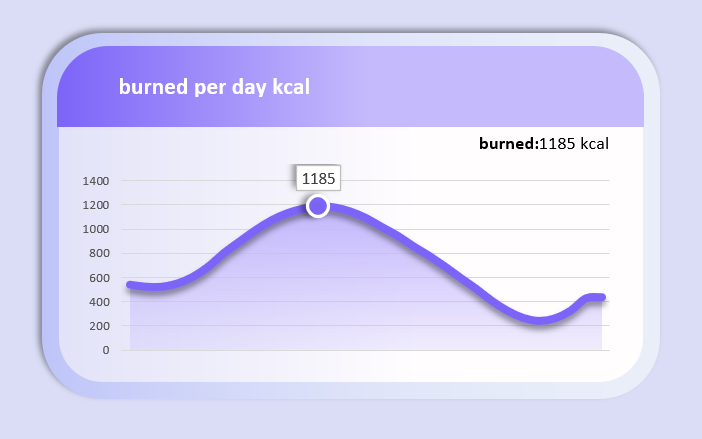
Scientists estimate that it takes 7,700 kilocalories to burn 1 kg of pure fat, but when losing weight without harming your health, you cannot lose more than 4 kg of total body weight per month!
On the right side of the block group the first is the weather information panel on the basics:
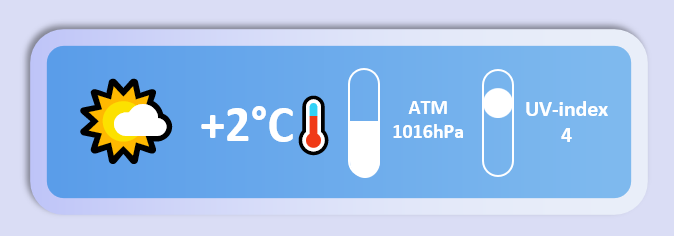
- cloudiness;
- air temperature (in Celsius or Fahrenheit at the appropriate mode selected on the calendar);
- atmospheric pressure in hectopascals (standard 1013 hPa);
- intensity of solar ultraviolet light (UV-index intensity levels 1-5).
A safe level of ultraviolet light intensity for the eyes is considered to be less than 3. At UV-index=3 or higher, sunglasses are recommended.
The block below gives additional information about the weather and environment on the 3 values:
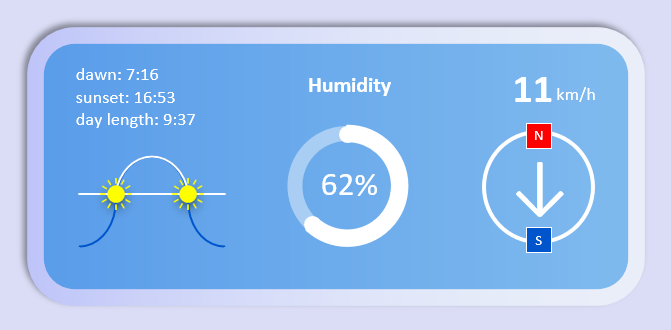
- Longitude of the daylight hours. The graph shows the position of sunrise and sunset on the selected date. In the initial data, just specify the time of day in the format of cells "Time" and the graph will automatically determine the angle of the sun relative to the dial mechanical clock for both sunrise and sunset. There is no need to convert anything, everything is ready and provided. This graph is recommended for convenient and effective use in other presentations for their Excel data visualizations.
- Air humidity as a percentage of maximum is no more than 100%. Normal air humidity is in the 40%-60% range. When exercising in dry air, your lungs are the first to suffer, as well as your eyes, skin, and teeth!
- Wind Speed and Direction. On the calendar you can switch the wind speed display format between kilometers per hour (EUR) or miles per hour (USA).
The last data visualization block on the dashboard in the lower right corner shows the dynamics of outdoor walking activity:
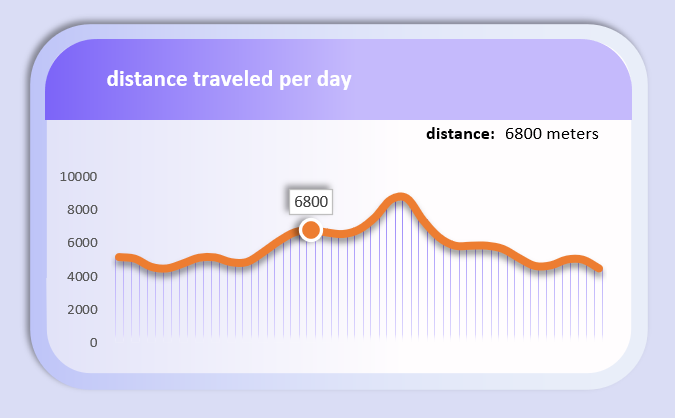
This displays the number of meters walked each day for the entire month. It is recommended to walk at least 5,000 meters outdoors every day. The total daily walking distance should reach between 8,000 and 15,000 meters.
At the very bottom of the dashboard is a block of skin switching buttons to visually change the appearance of the dashboard with a style design in one of 4 options:

- INDI - light purple background with elements of Indigo color shades.
- LEAF - a spring style of green foliage.
- SKY - stylish color scheme with saturated blue colors.
- AIR - unobtrusive, light and airy style of interface design.
The user can choose the color scheme of the dashboard template to his taste:
 Download fitness calendar with weather analysis in Excel
This template contains no macros, and all functionality is implemented using formulas and standard built-in tools in Excel: form controls, summary tables, etc. Fill in the table with your input data on the "Data" sheet or change the functionality with formulas on the "Processing" sheet to optimize everything for your needs and use it freely in Excel for personal purposes.
You can read more about the effects of weather conditions on fitness training in the following article:
 Weather analysis and fitness calendar download in Excel
Interesting facts and materials about important weather factors from a sports perspective are provided.
It is hoped that fitness tracker manufacturers and wellness app developers will pay attention to this conceptual model. The gurus of fitness technology should offer the market their perfect solution for such an important need as the analysis of the correlation between the weather and the physical state of the body for a long time. After all, everyone is weather dependent!
