Gantt Chart Template for Project Management in Excel
The Gantt chart is undoubtedly one of the most powerful tools in project analysis, planning, and management. This visual tool allows for a clear representation of task progress, timelines, and dependencies, making it an integral part of project management tools. Are you ready to delve into the world of enhanced planning and management? Let's start with the first template - an online constructor!
How to build a calendar of plans with Gantt chart from Excel spreadsheet
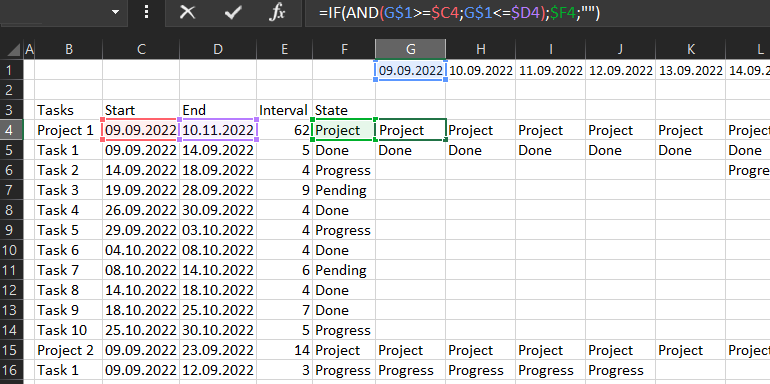
Fill the range of cells G4:O16 on the Gantt sheet with the same formula:
How to make a Gantt chart in Excel - step by step guide
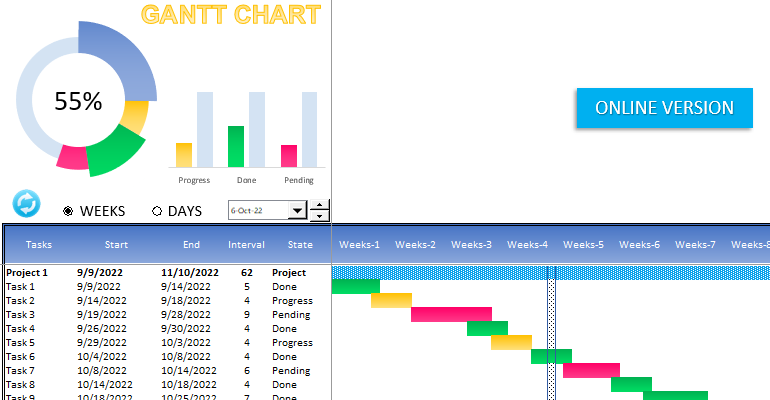
Gantt Chart Template OnlineGantt Chart Alternatives for Project Managers - online:
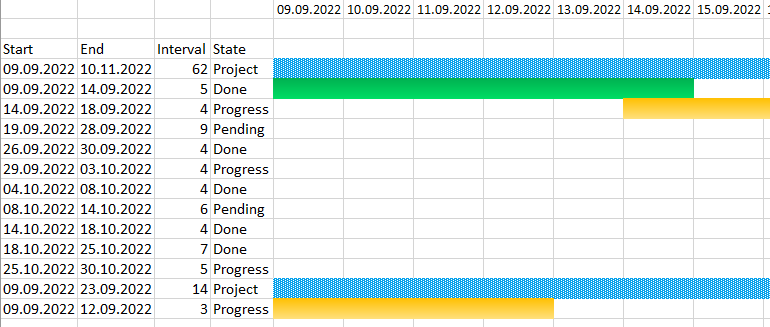
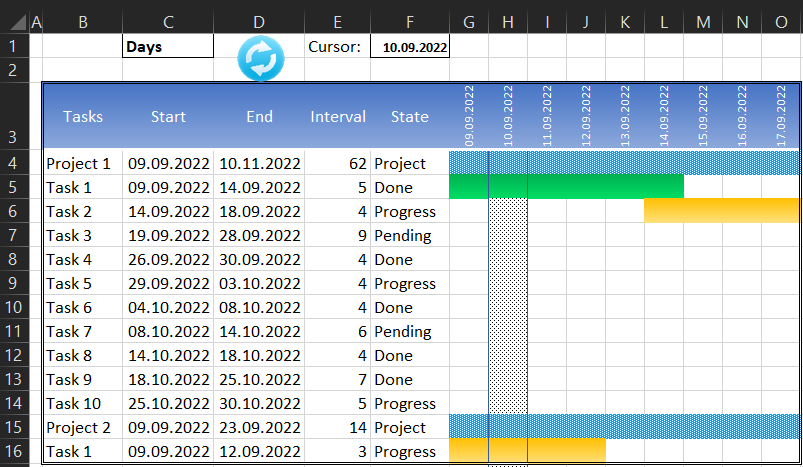
Rename the Excel worksheet name "Sheet1" to "Gantt". Then, on the same sheet, create a table with the source data exactly the same as shown in the figure below, with the same arrangement of all cells on the sheet:
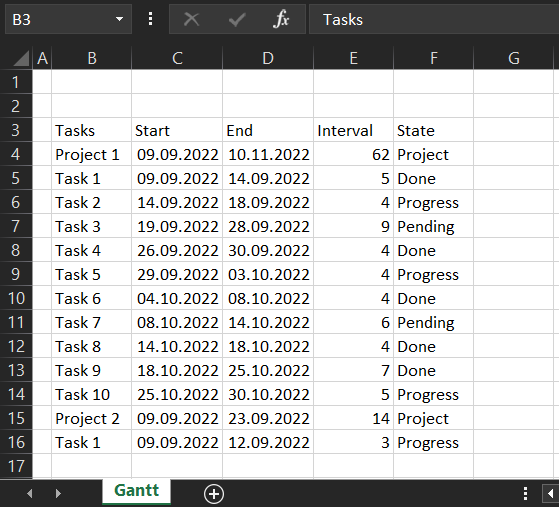
Important!!! So that all the addresses of the filled cells of the sheet completely coincide with the original one shown in the figure.
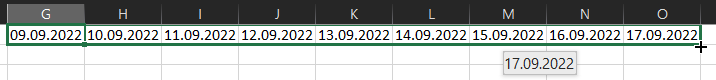
Using the marker in the lower right corner of the Excel cursor, fill the range of cells G1:O1 with alternating dates from 09/09/2022 to 09/17/2022:
Preparation of the initial data is completed, let's proceed directly to constructing a Gantt chart on the calendar.
Now select the cell range G4:O16 to give it conditional formatting:
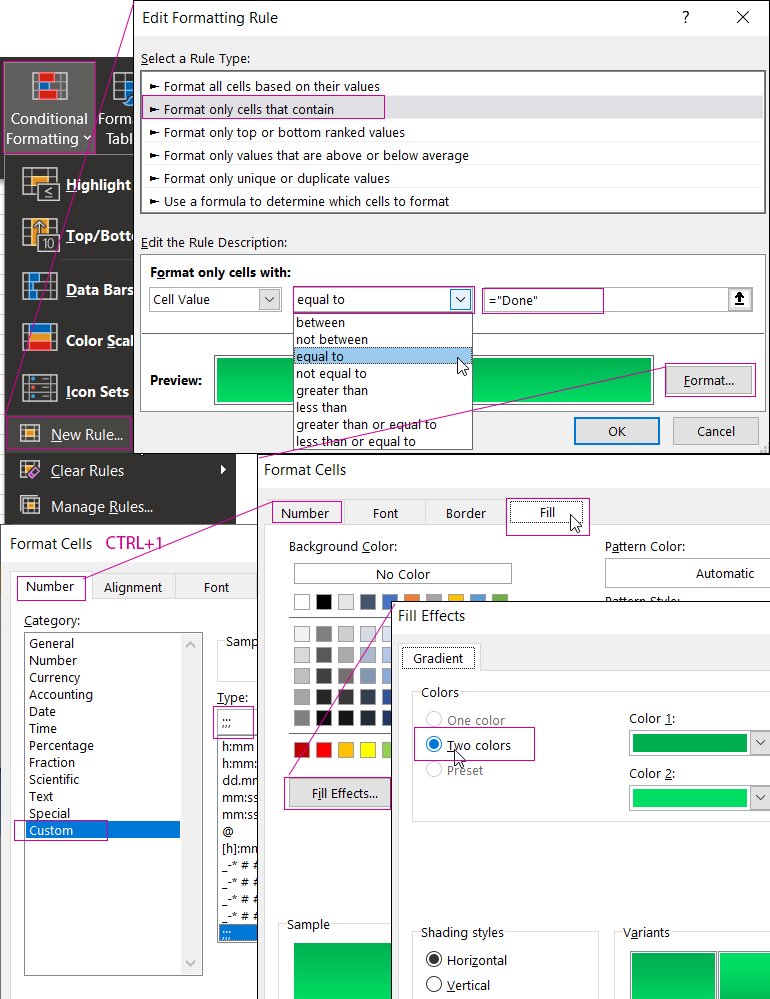
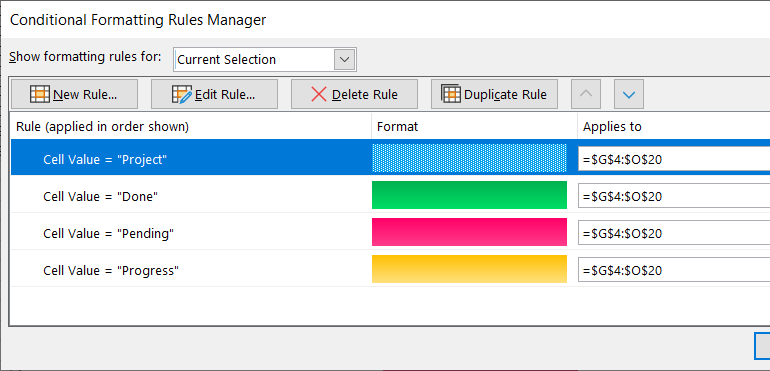
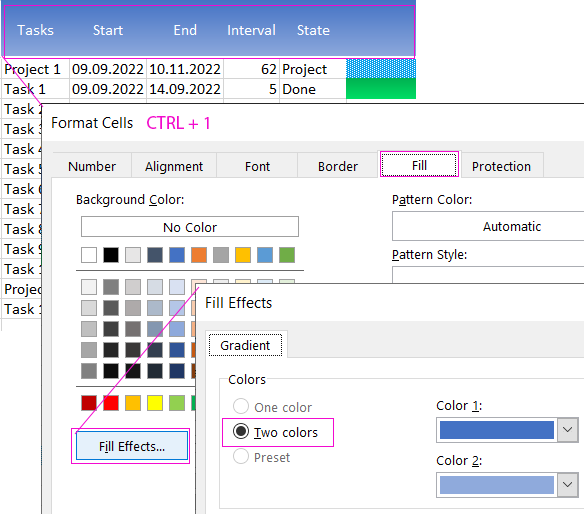
As you can see in the figure, the formatting rule is applied to cells with the text value “Achieved”, which is returned by formulas in the range G4:O16. For aesthetics, we again use 2 fill colors. It is also important to note that on the “Number” tab, using the “(all formats)” option, we set our custom format of three dots followed by “;;;” - this will hide the text content in the cells. We get the result:
Go to any cell in the range G4:O16 and open the Conditional Formatting Rules Manager. To do this, use the menu “HOME” - “Conditional Formatting” - “Manage Rules”. Using the “Create Rule” button, create 2 more rules for the values “In Progress” (yellow) and “Pending” (red):
Now let's create a cursor to highlight dates on the chart - this will make analysis using the Gantt chart more convenient. Again, go to any cell in the range G4:O16 and in the Conditional Formatting Rules Manager, create a new rule, but with the formula =G$1=$F$1 and other cell format settings:
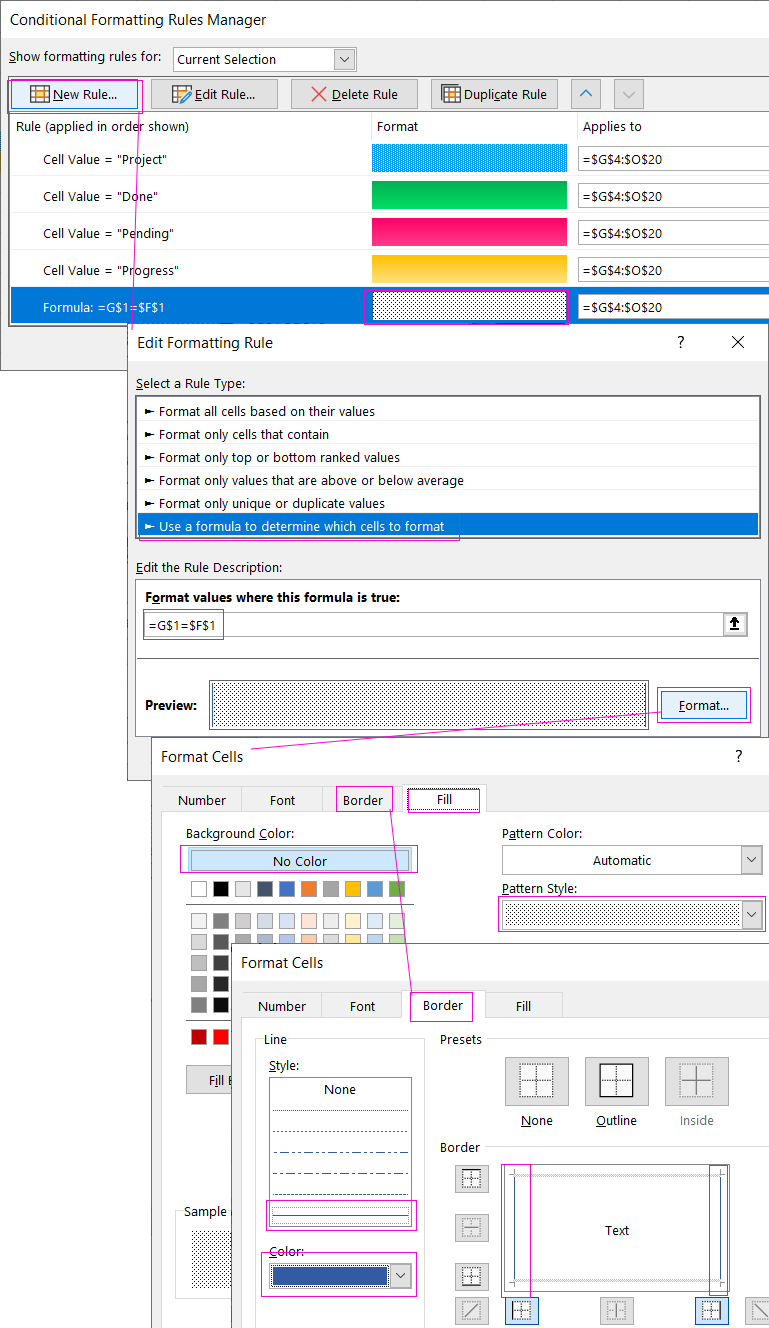
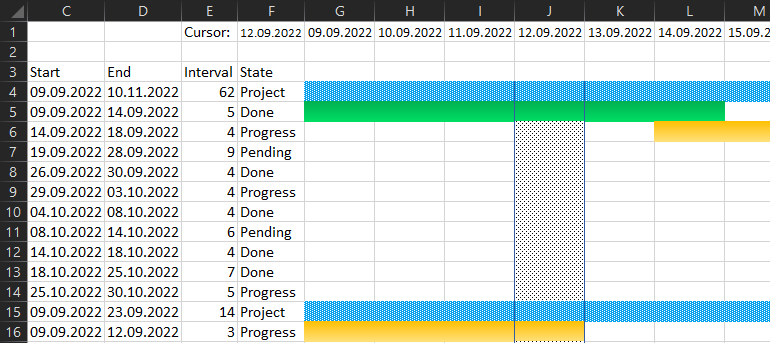
Please note! The cursor rule must be in the lowest layer. To control the order of formatting rules, use the corresponding Up and Down buttons in the manager. As a result, we get a Gantt chart with a cursor highlighting dates, which are indicated in cell F1:
Next, we design the table header in the range B3:F3 using a gradient fill of cells from two colors:
You should also change the font color to white in the table column headings.
How to manage a Gantt chart in Excel
Now in the Gantt chart we will make interactive controls from drop-down lists. Let's start with something simple. Move the Excel cursor to cell C1 to make the first drop-down list in it:
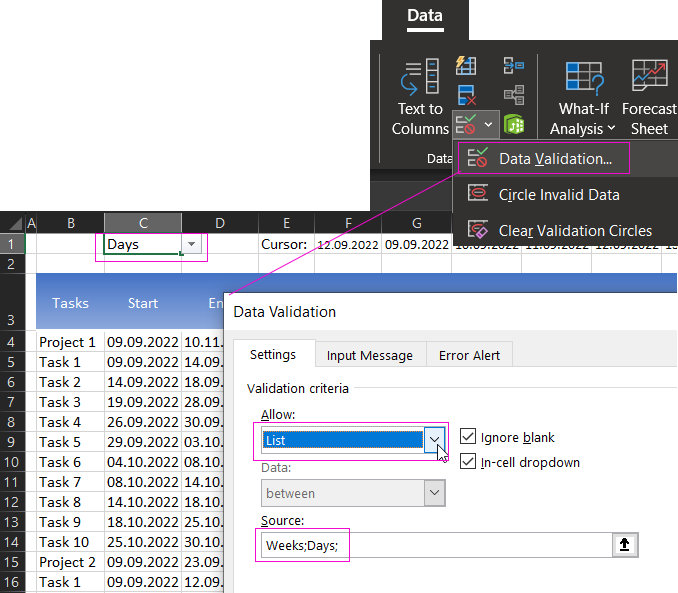
In the parameters for the “Source:” input field, specify two words separated by a semicolon “Days;Weeks”, click OK and a drop-down list of two values - READY!
The second dropdown will be more complex. Before creating it, first create a named range with the name “Date_List” and the formula:
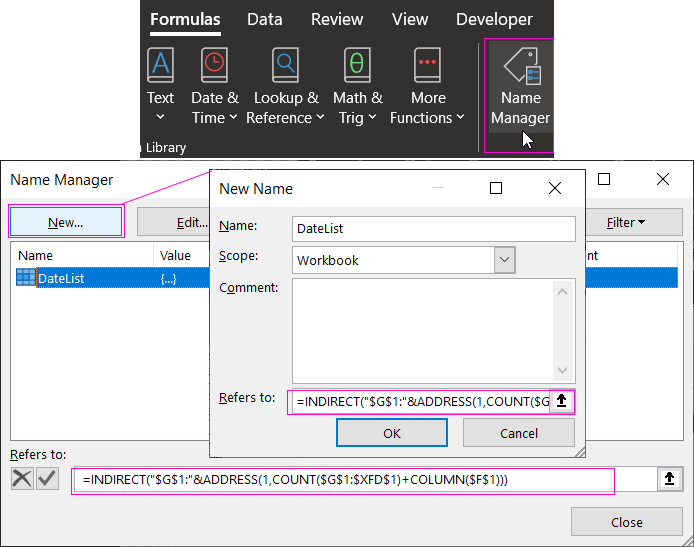
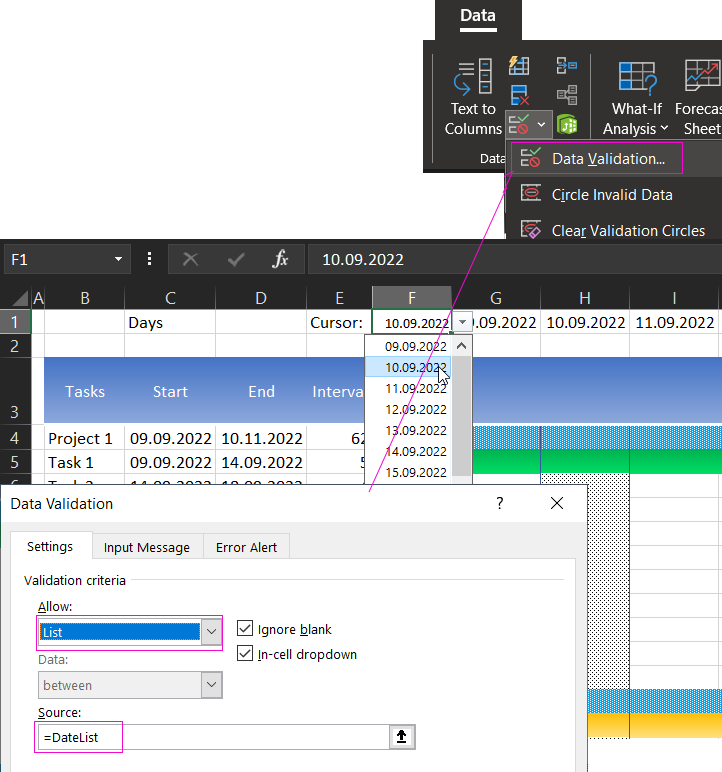
This name will automatically load into itself all dates located in the first row of the sheet starting from cell G1. And now we use a link to the same name (=List_dates) as the source for the second drop-down list in cell F1:
Now our cursor for highlighting dates is interactive and its movement on the Gantt chart is controlled using the drop-down list in cell F1.
The long-awaited moment has arrived when, using a VBA macro, we will do the magic to bring the Gantt chart to life. Open the Visual Basic Macro Editor by pressing the key combination ALT+F11 and create a new module with VBA program code in it:
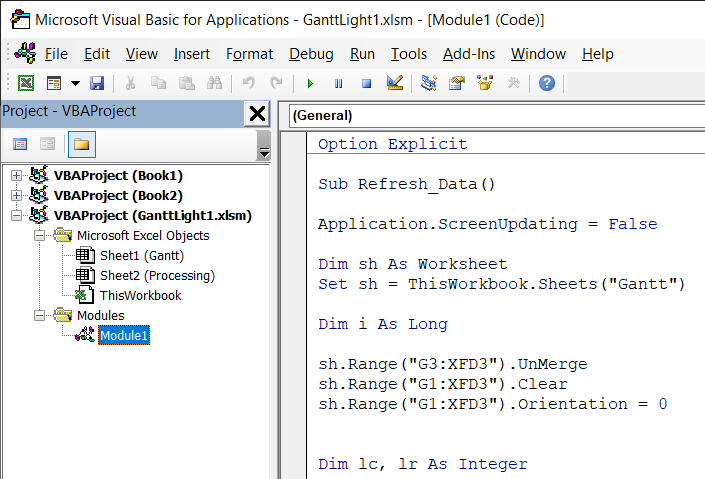
Full version of the macro code in the VBA programming language:
Option Explicit
Sub Refresh_Data()
Application.ScreenUpdating = False
Dim sh As Worksheet
Set sh = ThisWorkbook.Sheets("Gantt")
Dim i As Long
sh.Range("G3:XFD3").UnMerge
sh.Range("G1:XFD3").Clear
sh.Range("G1:XFD3").Orientation = 0
Dim lc, lr As Integer
For i = Application.WorksheetFunction.Min(sh.Range("C:C")) To Application.WorksheetFunction.Max(sh.Range("D:D"))
If sh.Range("G1").Value = "" Then
sh.Range("G1").Value = i
Else
lc = sh.Range("XFD1").End(xlToLeft).Column
sh.Cells(1, lc + 1).Value = i
End If
Next i
lc = sh.Range("XFD1").End(xlToLeft).Column
lr = sh.Range("B" & Application.Rows.Count).End(xlUp).Row
If sh.Range("C1").Value = "Days" Then
sh.Range("G3").Value = "=G1"
sh.Range("G3", sh.Cells(3, lc)).FillRight
sh.Range("E3").Copy
sh.Range("G3", sh.Cells(3, lc)).PasteSpecial xlPasteFormats
sh.Range("G3", sh.Cells(3, lc)).NumberFormat = "D-MMM"
sh.Range("G3", sh.Cells(3, lc)).Orientation = 90
sh.Range("G3", sh.Cells(3, lc)).EntireColumn.ColumnWidth = 2.5
Else
For i = 7 To lc Step 7
sh.Cells(3, i).Value = "Week-" & i / 7
sh.Range("E3").Copy
sh.Range(sh.Cells(3, i), sh.Cells(3, i + 6)).PasteSpecial xlPasteFormats
sh.Range(sh.Cells(3, i), sh.Cells(3, i + 6)).EntireColumn.ColumnWidth = 0.8
sh.Range(sh.Cells(3, i), sh.Cells(3, i + 6)).Merge
sh.Range(sh.Cells(3, i), sh.Cells(3, i + 6)).HorizontalAlignment = xlCenter
sh.Range(sh.Cells(3, i), sh.Cells(3, i + 6)).VerticalAlignment = xlCenter
Next i
lc = sh.Range("XFD3").End(xlToLeft).Column + 6
End If
sh.Range("G1:XFD1").NumberFormat = "D-MMM-YY"
sh.Range("G1:XFD1").Font.Color = VBA.vbWhite
sh.Range("H4:XFD" & Application.Rows.Count).Clear
sh.Range("G5:G" & Application.Rows.Count).Clear
sh.Range("A" & lr + 1, "A" & Application.Rows.Count).EntireRow.Clear
sh.Range("G1:XFD3").Locked = True
sh.Range("G1:XFD3").FormulaHidden = True
sh.Range("G4:G" & sh.Range("B" & Application.Rows.Count).End(xlUp).Row).FillDown
sh.Range("G4", sh.Cells(lr, lc)).FillRight
With sh.Range("B3", sh.Cells(lr, lc))
.Borders(xlEdgeBottom).LineStyle = xlDouble
.Borders(xlEdgeBottom).Color = vbBlack
.Borders(xlEdgeLeft).LineStyle = xlDouble
.Borders(xlEdgeLeft).Color = vbBlack
.Borders(xlEdgeRight).LineStyle = xlDouble
.Borders(xlEdgeRight).Color = vbBlack
.Borders(xlEdgeTop).LineStyle = xlDouble
.Borders(xlEdgeTop).Color = vbBlack
End With
sh.Range("B4", sh.Cells(lr - 1, 6)).Select
Selection.Borders(xlEdgeBottom).LineStyle = xlNone
Selection.Borders(xlInsideHorizontal).LineStyle = xlNone
Range("C1").Select
End Sub
To use the macro we need a new (3rd) Gantt chart control. It will serve as a simple small picture in the form of a button with an “Update” icon. Copy a picture from any source and paste it directly into an Excel sheet. And then we connect our Refresh_Data macro to it:
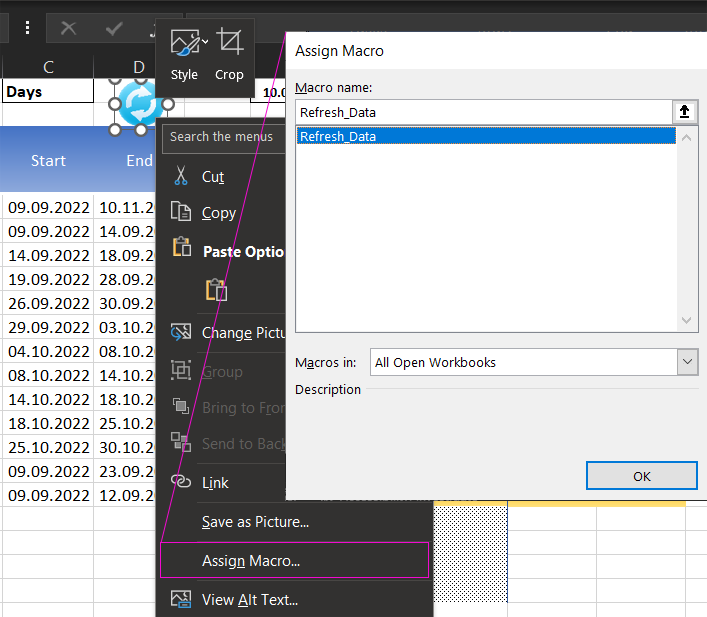
Click on the button and enjoy the “magic” of automating work in Excel using macros:
As the French say “Vu a la”!
Switching days and weeks for the Gantt chart on the plan calendar
Then the magic continues. The question arises: why did we need the first interactive Gantt chart control element - a drop-down list? All you just need to do is create another macro, but this time not in a module, but in a sheet. We return to the macro editor ALT+F11 and in it open the “Gantt” sheet to enter a new macro code:
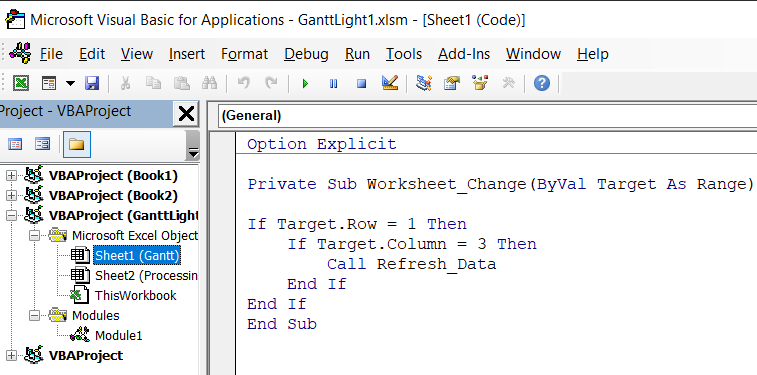
Macro code for calling from an Excel sheet:
Option Explicit
Private Sub Worksheet_Change(ByVal Target As Range)
If Target.Row = 1 Then
If Target.Column = 3 Then
Call Refresh_Data
End If
End If
End Sub
Let's test the second macro by using the first drop-down list to switch from the “Days” value to the “Weeks” value:
The second macro is used only to call the first one when updating the value in cell C1 - where the first drop-down list is located.
 Download Gantt chart template in Excel
Not all the capabilities of the first macro are described here. For example, when you populate a table with new values and click the refresh button, the table automatically spans the new range of values and adds them to the chart. Thus, the Gantt chart is automatically expandable and can be used as a template ready for full-fledged work with new users.
