How to Count Filled and Empty Cells in Excel
Excel offers several functions for reading and counting values in a range of cells: COUNT(), COUNTIF, and COUNTBLANK. Each of these functions reads and counts values differently, depending on whether the value is a number, text, or an empty cell. Let's explore these functions in action with a practical example.
COUNT, COUNTIF, and COUNTBLANK Functions for Cell Counting in Excel
Below is an illustration of different methods for counting values in a specific range of table data:
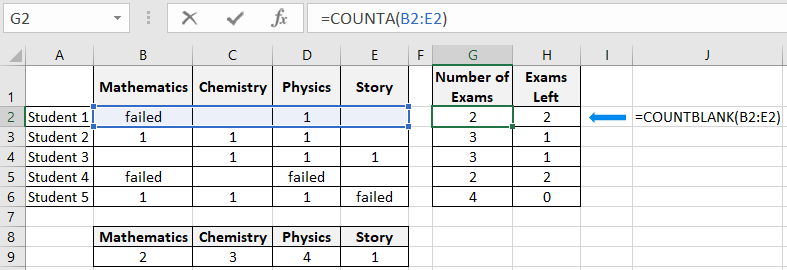
In row 9 (range B9:E9), the COUNT function counts numeric values only for students who passed the exam. COUNTIF in column G (range G2:G6) counts the numbers of all exams taken by students. In column H (range H2:H6), the COUNTBLANK function counts only for exams that students have not yet taken.
Principle of Counting Cells with COUNT, COUNTIF, and COUNTBLANK Functions
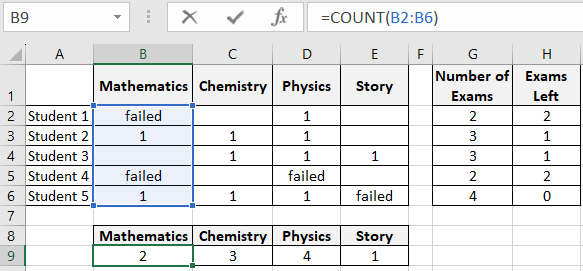
The COUNT function counts only the numeric values in the specified range. This formula requires specifying only one argument—the range of cells. For example, the formula below counts only the cells (in the range B2:B6) that contain numeric values:
COUNTIF counts all non-empty cells. This function is useful when you need to count cells with any data type: text or number. The formula syntax requires specifying only one argument—the data range. For example, the formula below counts all non-empty cells in the range B5:E5.
=COUNTIF(B5:E5)
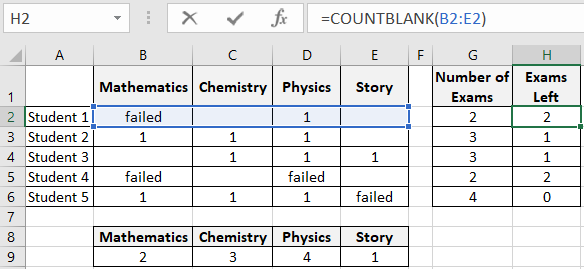
The COUNTBLANK function counts only empty cells in the specified range of table data. This function also requires specifying only one argument—the reference to the data range. For example, the formula below counts the number of all empty cells in the range B2:E2:
As seen from the examples above, each function has its specific purpose and simplifies the data processing process, providing the ability to bypass complex combinations of IF statements.
How to Use COUNTBLANK, COUNTA, and COUNTIF Functions in Excel Formulas
For practical application of formulas using COUNTBLANK and COUNTA functions, let's consider an example. A data visualization developer in Excel needs to create the simplest Gantt Chart for a two-week time period without using macros. To efficiently solve this task, the developer will use conditional formatting and formulas.
The original table is as follows:
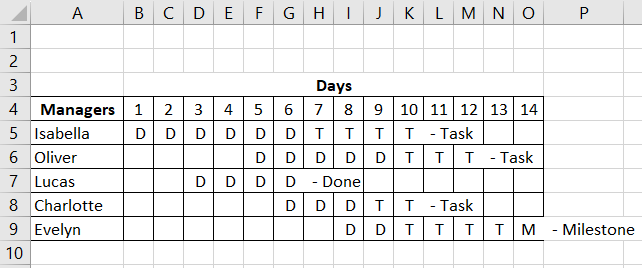
In the column headers of the table body, the sequential numbers of days from 1 to 14 are located. And in the row headers, the names of managers responsible for contract tasks in specific periods of the implementation of a two-week project are arranged.
The body of the table will be filled with four types of Gantt Chart data:
- Task.
- Done.
- Milestone.
- Blank Cell.
During the chart's operation, the user fills the body of the table with corresponding values concerning the time period set for specific tasks and the manager responsible for their completion on time.
This simple Gantt Chart can assess the progress of each task and the project as a whole, depending on the filling of the table body with corresponding values. These functions are implemented through formulas. For example, to determine the task's duration concerning the total number of days set for the project's implementation, the formula in cells P5:P9 is used:
=COUNTA(B5:O5)/(COUNTBLANK(B5:O5)+COUNTA(B5:O5))
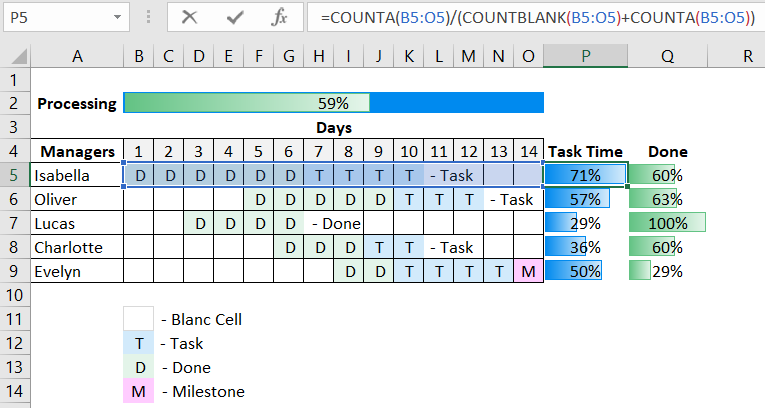
This formula evaluates the task's duration relative to the total number of days set for the project's implementation. Thanks to the COUNTBLANK and COUNTA functions, we can always get the number of cells in the table body. Now we are not limited to the need to increase the table size by adding new cells to use this Gantt Chart template for other accounting periods.
To display the task completion level in the range Q5:Q9, we use the formula to count the total number of entries in the row relative to the number of cells with the value "D – Done":
=COUNTIF(B5:O5,$B$13)/COUNTA(B5:O5)
 Download
The complexity of any task is determined by time. Therefore, to set the desired request, it is always advisable to specify a deadline, and then the desire will turn into a goal. Set goals and achieve them instead of devaluing the joy of current days with inadequate desires.
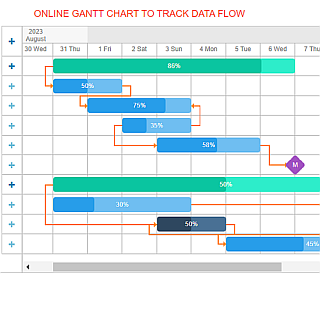 How to use Gantt Chart to visualize data flow online