How to Use Excel for Percentage Calculations in Sales
One of the frequently performed tasks in Excel is adding or subtracting percentages from a value. For example, when prices of goods increase, the initial price is usually raised by a certain percentage. When offering discounts to customers, the price is reduced by a certain percentage.
How to Add a Number and Percentage in Excel
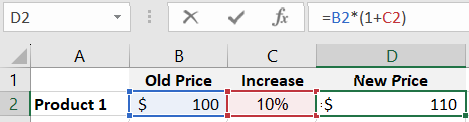
The example below visually demonstrates how to add or subtract a percentage in Excel. A simple formula is used for this purpose. In cell D2, 10% is added to the price of item 1. In cell D5, Customer A is given a discount of 20%.
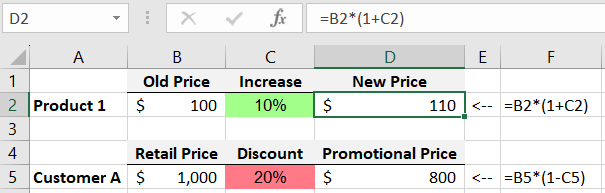
To add a specified percentage to a value, simply multiply that value by 1+the given % in a cell with percentage format for display. For example, in the image, the price of item 1 is increased by 10%. First, add the number 1+10%, resulting in 110%. Then, multiply the original price of $100 by 110%. The calculated price using this method is $110. To ensure that the addition of one and the percentage is executed first, place them in parentheses.
Excel always follows the rules of the order of mathematical operations – multiplication always comes first! The presence of parentheses increases the priority of the addition operation before multiplication.
How to Subtract a Percentage from a Number in Excel
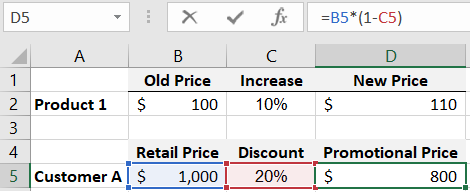
To decrease a value by a specified percentage, again multiply the original value by 1, but this time -20%. In the example image, Customer A is given a discount of -20%. Subtract 20% from one, resulting in 80%. Then, multiply the initial price of $1000 (before the discount) by 80%. The calculated new price using this method is $800. Similar to the previous example, to ensure that the subtraction of the percentage from one is executed first, place it in parentheses.
Also read: Adding and Subtracting Percentages in Excel
If parentheses are not used in the formulas for adding and subtracting percentages, the results of their calculations will be incorrect!
Example of Increasing and Decreasing by a Percentage Value in Excel
Let's simulate a situation for a practical example of applying formulas to decrease and increase numerical values by a few percentages.
One developer experienced a decline in sales during the season. The developer sold real estate in new buildings using the traditional scheme. The average cost of housing is around $100,000. If a customer currently lacks the financial ability to buy a home, they are offered a 10-year installment plan with a small markup of 10%. This means that upon closing the debt in 10 years, customers would have paid an average of $110,000 for the home. Despite these conditions, real estate sales were decreasing exponentially.
Example: How to Boost Sales by Raising Prices
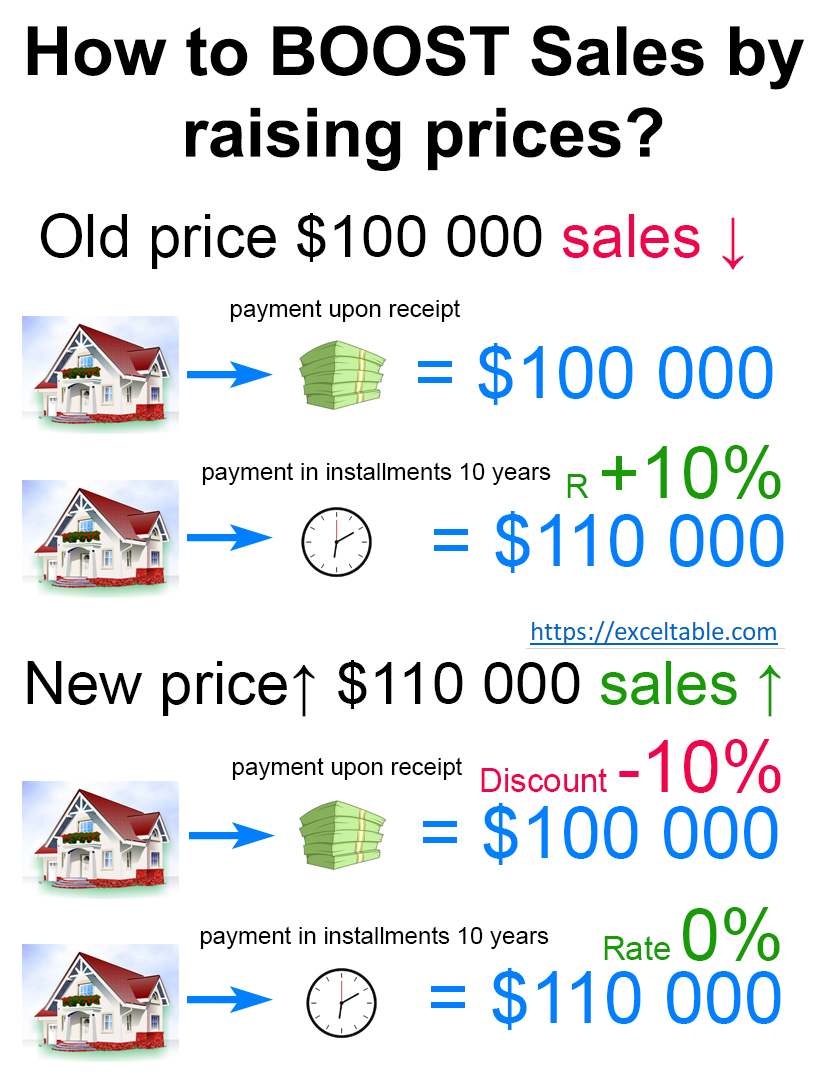
On the 13th day of the busiest sales month in the region, the developer hired a new director to manage the marketing department. To increase sales, the new marketing director immediately changed the offer for customers in an unconventional way for the company. To boost sales, the director increased the initial price of the developer's real estate to an average of $110,000. Now, the offer is as follows: Anyone who buys a home from the developer in a new building has the opportunity to get a 10-year installment plan at 0%. And those customers who buy without an installment plan receive a 10% discount.
As a result, the margin for the sold real estate for the developer remained unchanged, but the trend direction of sales volume changed from descending to ascending. Sales increased by the end of the month.
Technical Task for Data Visualization Developer in Excel
Create a visualization of the real estate sales history in a seasonal month, where the trend dynamics changed on the 13th day. The developer provided us with only the history of changes in sales volumes in percentages (Column C on Sheet 2). Actual sales amounts are confidential information for the company. Based on this data, we will model an example with an initial average volume as of the first day of the month, $100,000 (Cell B2). Then, depending on the history of changes in percentages, we adjust the daily volume using formulas (in the range of cells B3:B32):
=B2*(100%+C3)
For clarity, see the image:
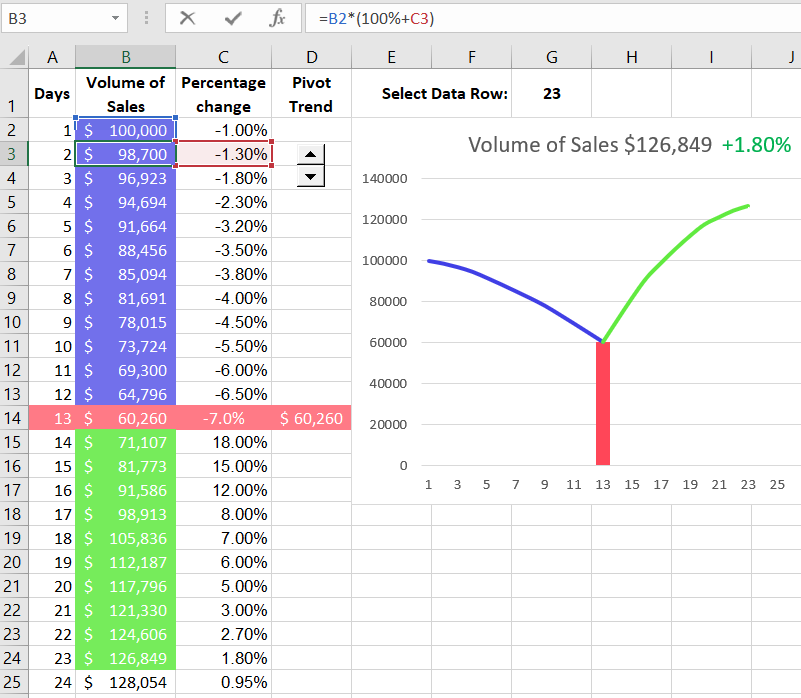
Note! If negative and positive values are used in percentages, the same formula is used for both decreasing and increasing numbers, as shown above in the image.
 Download
Office employees often have to work with percentage values in Excel. Therefore, it is important to initially learn to understand the rules of Excel, starting from the peculiarities of the percentage cell format, which is significantly different from the numerical format. Further explore formulas and functions for analyzing interest rates, methods of calculating percentages, and more. All this can be found on our website with templates of ready-made examples. Learn while enjoying the process.
