Download Excel charts for free to visualize your data
Present reports with stunning and attractive chart designs. Free Excel chart templates for visualizing data in interactive reports. Convenient templates will help you easily and quickly create dynamic charts based on a sample. Download them for free and start improving your pivot tables for presentations right now! Build your dashboard templates from the data visualization templates presented in this collection like a constructor.
Download Free Excel charts for creating dashboards
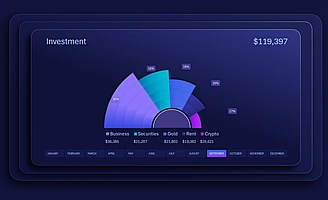 Fan Chart in Excel as a design concept for dashboards.
An example of how to create a fan chart in Excel to use it as a stylish data visualization element in dashboard design. Modern design for interactive reports.
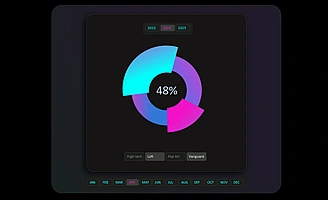 Interactive Pie Chart with cursor for Excel dashboard design.
Use an interactive cursor chart in Excel for a stylish dashboard. Control data display, highlight required data segments interactively, and create reports ready for presentation.
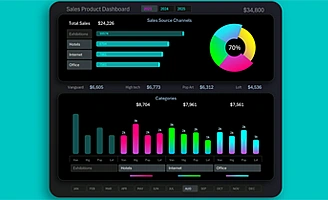 Compact Excel dashboard for sales analysis in small business.
A Mini Dashboard template for fast visual analysis of product assortment segmentation based on sales performance across different markets and categories. Effective control of key indicators in Excel.
 Coverage progress chart in Excel for achieving goals.
Excel template for coverage progress chart to track goal achievement. Visual representation helps control results and maintain motivation.
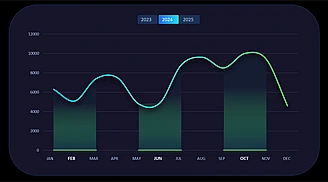 Beautiful simple interactive line chart in Excel.
Download the simple and elegant interactive line chart with a cursor for clear data analysis. This chart helps explore trends, switch periods, and enhance dashboard visualization.
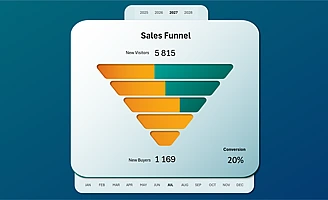 Sales Funnel Chart in Excel for CR progress analysis.
Sales funnel chart template in Excel for visualizing progress at each sales stage. The clear structure helps evaluate how visitors convert into customers.
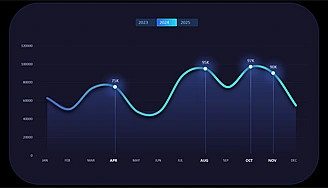 Interactive Line Chart in Excel for Data Visualization.
Example of an Excel interactive line chart template for visualizing metric changes over time. Connecting and configuring controls makes trend analysis simple and convenient.
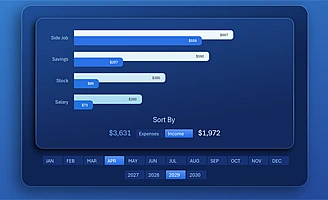 Horizontal Ranking Bar Chart in Excel with Sorting.
Horizontal bar chart template in Excel for convenient analysis of income and expense rankings with category sorting. The chart quickly compares values and highlights leaders.
 Speedometer Chart for KPI metrics on an Excel dashboard.
Excel speedometer chart template for visual KPI tracking. This convenient visualization helps quickly evaluate goal achievement and make data-driven decisions.
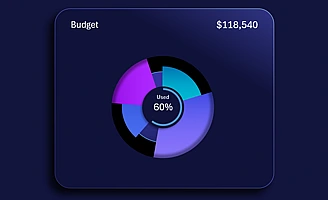 Excel Budget Segmentation Chart by expenses and income.
Chart template for presenting the budget structure in Excel. Clear distribution of budget expenses and funding sources by category across different accounting periods.
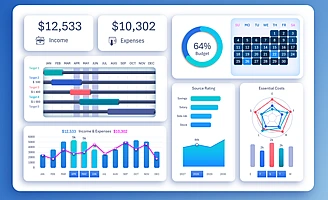
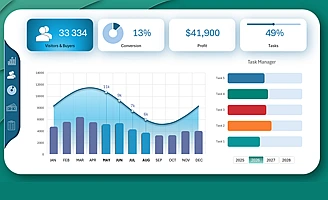 Simple and beautiful Excel dashboard for data visualization.
A simple yet very beautiful Excel dashboard template designed for beginner developers of interactive data visualizations. Combined charts and chart control elements.
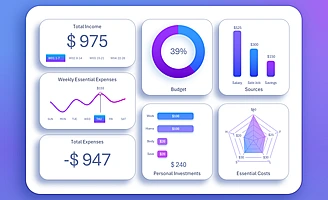
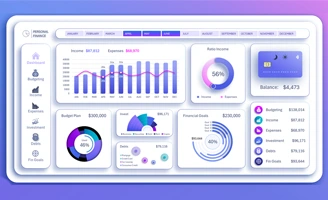 Excel Template for Personal Finance in Dashboard format.
Download the personal finance dashboard template in Excel and start managing your income and expenses. The clear charts will help improve your financial discipline and achieve your goals.
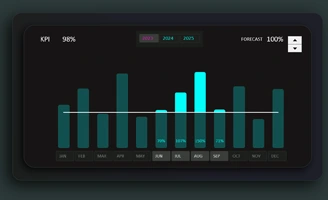 Excel Data Manipulator Chart for Interactive Forecasting.
Download the bar chart template with interactive data manipulation features. How to effectively forecast likely outcomes using data visualization?
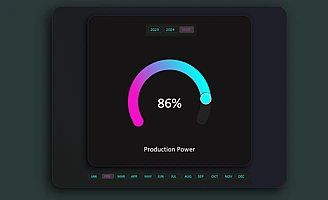 Dynamic Gauge Chart in Excel for Dashboard UI Design.
Download the speedometer gauge chart template in Excel for dashboards. When it’s best to use a speedometer chart for visualizing data in interactive reports.
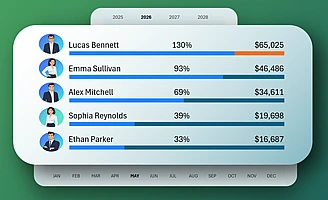 Dynamic Ranking Chart in Excel for Interactive Dashboards.
An example of a ranking chart template with a photo sorting feature for descending employee performance in Excel. A great idea for useful data visualizations with interactive features.
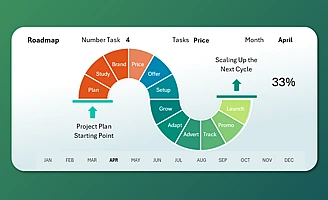 Excel Project Roadmap Chart for Beautiful Dashboards.
The Roadmap Chart template in Excel provides clear and dynamic visualization of project timelines, stages, and progress. It’s ideal for project managers or interactive dashboard developers.
 Excel personal finance dashboard for monitoring goals.
Download the personal finance management dashboard in Excel to track goals, income, and expenses. Budget optimization and money management in one tool.
 Weekly analysis of personal income and expenses in Excel.
Download the weekly dashboard in Excel for personal finances. Track income and expenses, analyze your budget, and enhance the management of your capital.
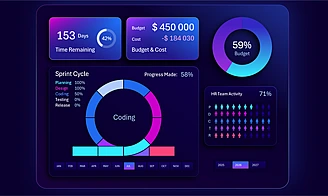 Sprint Cycle Chart in Excel for Scrum and Agile teams.
Download an example of how to build a sprint cycle chart in Excel for Agile and Scrum. Visualize sprints, monitor progress, and enhance team performance.
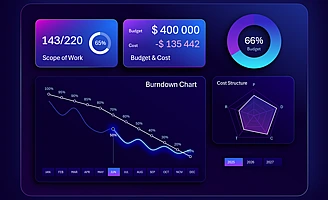 How to create a burndown chart in Excel for Agile Scrum.
Download the burndown chart template in Excel for project management using Agile and Scrum methodology. Effective task tracking and team progress control.

Data Visualization Charts for Interactive Report Creation in Excel.
Dashboard Templates