Benchmarking Logistics for Niche vs Mass Products in Excel
Logistics for niche and mass-market goods have their own characteristics because they serve different categories of consumers with different needs and preferences. In comparative business analysis, it is advisable to separate all types of logistics—warehousing, assembly, and transportation—according to these categories. To do this, a global filter should be added to the dashboard to separate logistics data for the niche market and mass market. Let's consider a good example implemented in Excel.
Differences between Logistics for Mass Market and Niche Market
To create a dashboard development specification, it is necessary to first familiarize oneself with the basic aspects of theory.
Key Differences between Mass Market and Niche Market Logistics
- Difference in supply volumes and warehouse storage. Mass market requires large volumes to maintain profitability, while niche markets do not.
- Requirements for transportation capabilities.
- Degree of order processing automation systems.
- Scope of supply network distribution.
- Cost of expenses.
It's also important not to forget about inventory management features, which directly affect logistics. Mass market utilizes strict IT systems (Just-In-Time) to minimize storage costs. Niche markets may have more flexible inventory management systems, as they have significantly lower demand and much higher margins. Lower supply volumes and high margins make it easy to maintain logistics profitability, which mass market goods cannot afford.
Profitability plays a huge role in this craft. For example, one could recall the writings of the great strategist and thinker Sun Tzu. One bushel of trophy grain equals ten bushels of native grain. This refers to the inflation of strategic resources due to logistics costs. Therefore, planning, control, and auditing of expenses in any form of business on any market should not be underestimated.
Dashboard for Comparative Analysis
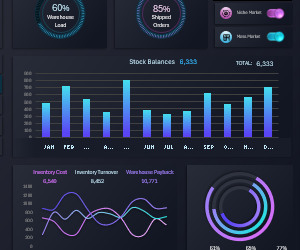
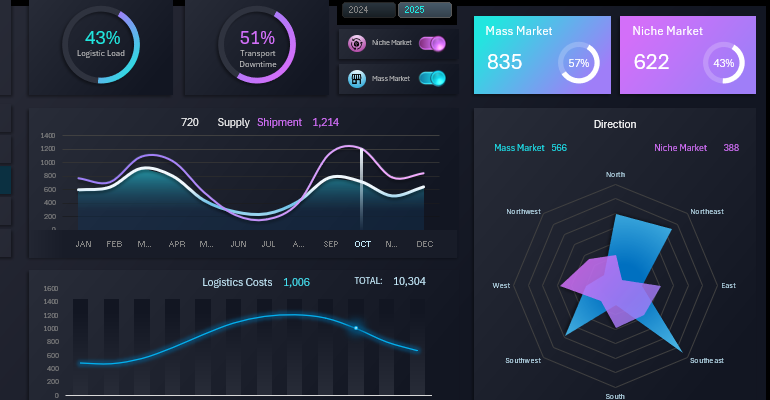
This is the third and final part of the dashboard presentation for comparative analysis of products for niche and mass markets. Global filters and slices, as well as a block with summary values for two basic indicators, remain unchanged:

First Diagram Block
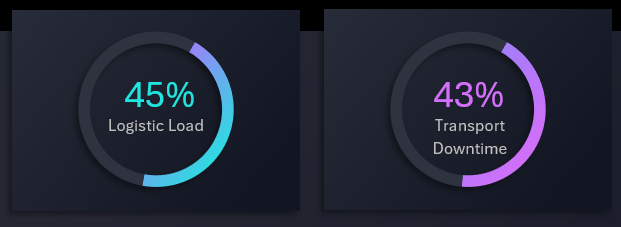
Here we visually monitor the level of logistics load and the percentage of transport downtime. It is desirable to implement this so that these data are updated in real-time mode. Fortunately, Excel's standard tools allow you to configure this in a few mouse clicks: Data → Get & Transform Data → Get Data.
Comparative Analysis of Deliveries and Shipments
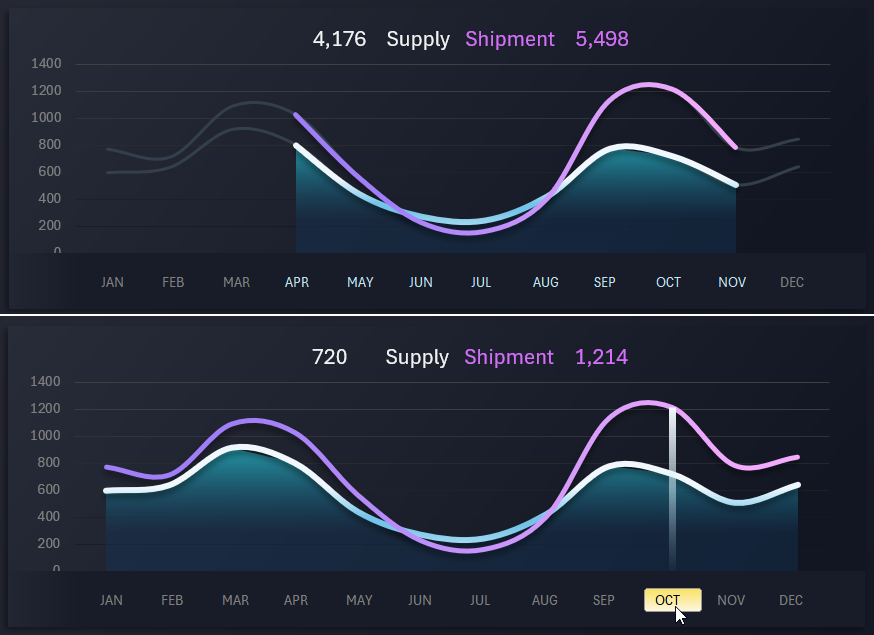
This allows us to track the dynamics of data changes for deliveries and shipments of goods throughout the year. As shown above, this block can work in several modes of displaying data, thanks to its own control element. For example, in data sampling mode for several months or a filter for a slice for a specific month.
Analysis of Logistics Expenses
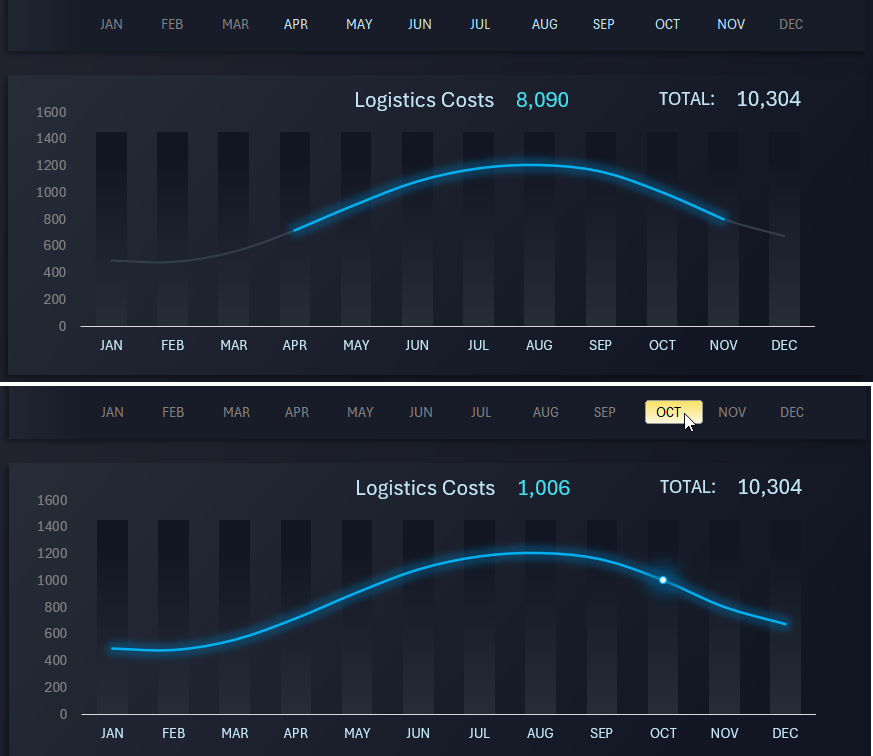
An important visualization block for controlling logistics expenses. Also works in several modes, but does not have control elements. The chart is controlled by the previous block. The control elements of the previous block apply to the entire dashboard and all charts.
Distribution of Goods by Directions
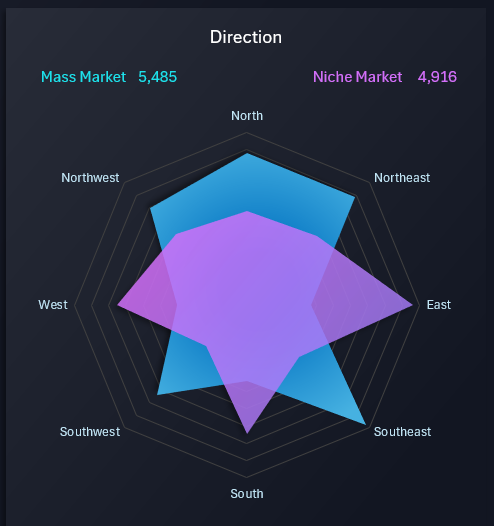
A Radar chart visually presents data on the direction of flow of commodity deliveries. The data is segmented into two basic categories of goods.
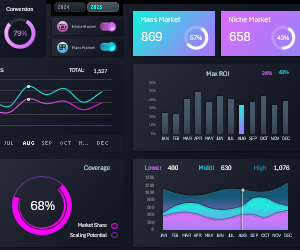
Third Fifo Logistics Dashboard
This is the final screen of the dashboard for comparative analysis of product sales in niche and mass markets:
Download the dashboard for comparative logistics analysis in Excel 
Logistics for niche and mass markets requires different strategies and approaches that take into account their unique features and customer needs. Therefore, it is important to use data visualization for comfortable control and timely decision-making.
SUMMARY REPORT:
STOCK CONTROL: