Comparison of sales in niche vs mass market on Excel Dashboard
Our dashboard offers an insightful exploration into the sales comparison between niche and mass market products. It enables thorough analysis of the characteristics and key differences between these two fundamental directions. Ideal for business owners in the trading industry.
Advantages and Disadvantages of Niche Market and Mass Market
The objectives of using the dashboard are laid down during its design phase. The main comparison function of this template should be outlined in the technical specification for the developer, comparing sales of goods across two global categories:
- Niche Market: Specialized products targeting a specific audience to gain loyal customers.
- Mass Market: Mass-consumption goods with broad audience coverage and high demand.
Dashboard users should be able to quickly assess the market situation and get a clear answer to the question: "What brings more profit today: quantity or quality?" Niche markets and mass markets have their own advantages and disadvantages. A comparative analysis will help better understand the differences between niche markets and mass markets in the context of product sales and develop appropriate strategies for each of these segments.
Advantages of Niche Market
- Low competition.
- High margins – up to 70%.
- Brand loyalty among consumers.
- Flexible response to market fluctuations: both positive and negative.
Disadvantages of Niche Market
- More limited growth potential.
- High dependency on market conditions.
- High marketing costs.
Advantages of Mass Market
- Broad audience coverage.
- Potential for significant cost reduction through increased sales volume.
- Mass-consumption goods do not require expensive advertising.
Disadvantages of Mass Market
- High competition.
- Business profitability requires large sales volumes due to low margins.
- Significantly lower proportion of repeat customers.
Question: "What's the difference between money and finance?"
Answer: "If it's less than $1,000,000,000, it's money; anything more than $1,000,000,000 is already finance." Finance is made on the mass market.
The Global Problem of Mass Market and Niche Market Imbalance in Macroeconomics
Today, we live in an era of overproduction and excessive consumption. Economic efficiency today is determined by GDP growth. And for its growth, an increase in the consumption of natural resources is required. Perhaps, if there were no financial crises, we would already be experiencing a global ecological crisis under such conditions. Therefore, as long as economic efficiency depends on GDP (i.e., on consumption growth), the largest capitals are in the mass market. It is on this market that billions and trillions are made.
Perhaps, we will live to see the time when economic efficiency will be determined by the efficiency of resource use, rather than their consumption. Perhaps then, the niche market will become a priority for large investors. At some point in history, for example, when craftsmanship was more popular than assembly-line production, we may return to controlled resource consumption under different circumstances. After all, at one time, mixes for building castles from slaked lime were prepared for future generations 100-200 years ahead with care for descendants. History has a tendency to repeat itself! One generation creates, the second benefits, and the third generation destroys.
Therefore, answering the first question at the beginning – quality is still more important than quantity for humanity in the long run. Because everyone benefits from quality. And in modern business, both sides should always remain winners. But the market dictates its rules, and we should learn to manage it through data visualization, even at the microeconomic level of small businesses.
Dashboard Structure and Example of Its Use for Comparative Analysis
The dashboard consists of three screens:
- Main screen SUMMARY REPORT.
- Child screen STOCK CONTROL.
- Child screen FIFO LOGISTICS.
In this article, we will examine the functionality of the main screen, and in subsequent articles – the subsequent child screens. At the end of the article, you can download the ready-made template with an example of the dashboard structure in MS Excel file format *.xlsx (without macros, but with full support for interactive functionality implemented using formulas and pivot tables).
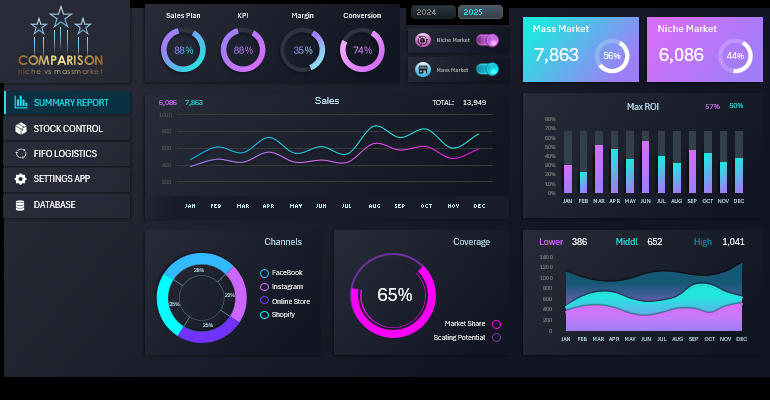
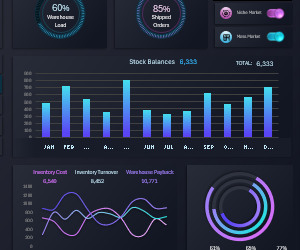
Key Sales Performance Chart Block
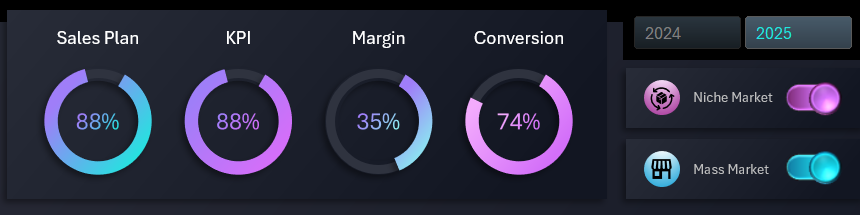
This block consists of four charts with key summary sales indicators:
- Share of sales plan achievement for the selected accounting period.
- Key Performance Indicators - KPIs.
- Business margin level.
- Sales conversion rate.
All indicators are provided in relative percentage values, and some of them may exceed 100%. In such cases, the diagram will display the portion exceeding 100% in white.
To the right of the chart block are the global dashboard control elements. The top one is used to switch between years for data sampling from the collected statistics. Below are two filter switches for including or excluding data segments about the sales of goods for the niche market and mass market.
When one of the product segment categories is disabled, the data on the entire dashboard and on all screens are updated according to the criteria of the filter selection. Thus, we can use the same dashboard to analyze sales of products only for the niche market or only for the mass market, as well as for general summary information about sales. This is very convenient for real-time comparative analysis.
Chart for Comparative Sales Analysis
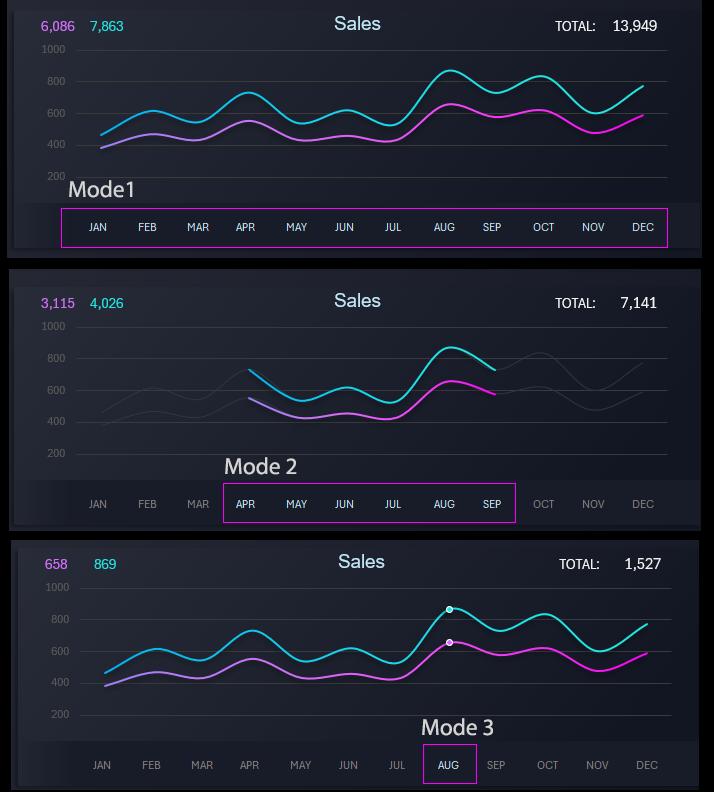
In this block, we compare the dynamics of monthly sales volumes in the niche and mass market categories throughout the specified year. The block also contains a dashboard control element for sampling and filtering data by months. Above in the picture, all 3 data presentation modes for the selected accounting period are shown:
- Entire year.
- Data sampling for only 6 months of the sales season from April to September.
- Data sampling for only 1 month - August.
When working with the control element, all data on the dashboard are updated according to the selected period.
Sales Channels
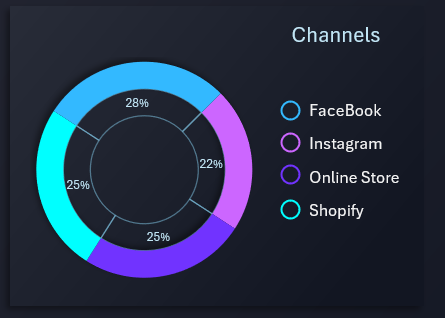
In this block, a comparative analysis is performed between different sales channels actively used by the business. Dashboard users can visually assess the distribution of flows through communication channels with customers. This block also helps adjust the advertising campaign strategy for product promotion and attracting new customers.
Market Share
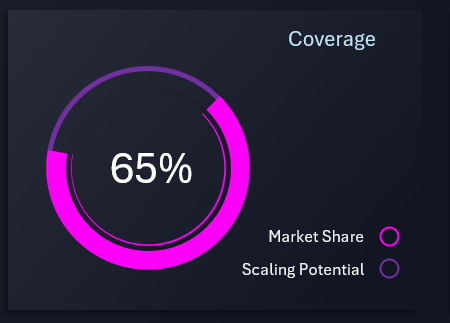
This block provides summary information on the scalability potential of the business in the markets. When using the global filter, you can separately analyze and compare each market: niche, mass market, or overall. You can also see in which periods and under what conditions (taking into account other dashboard indicators relative to this block).
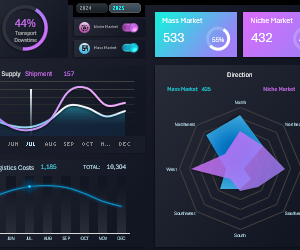
Summary Information Block on Two Global Market Categories

These are the two main markers on the dashboard with summary information about the indicators of two global categories: niche and mass market. This block displays the same values on different dashboard screens but updates its data based on the selection by control elements and data filters. Thus, dashboard users can focus on the main information during analysis while comparing it with other indicators and conditions on different screens.
Maximum ROI Indicator
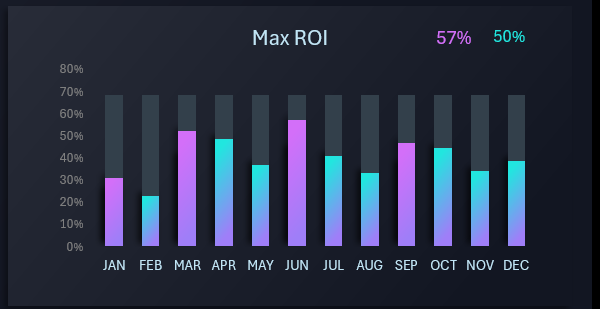
This is one of the most important blocks for analyzing business efficiency in different markets. Here, we analyze in which month for which market the maximum ROI (Return On Investment) value was achieved. Thus, business owners can determine under what conditions it was more rational to invest in trading a certain category of products for mass consumption or niches. The highest ROI indicator is in June (57%). As seen in the picture, in January, March, June, and September, investments in niche market products yielded better returns. In other months, investment efficiency was higher for mass consumption goods. The highest ROI indicator in April (50%) for this product category.
Average Check
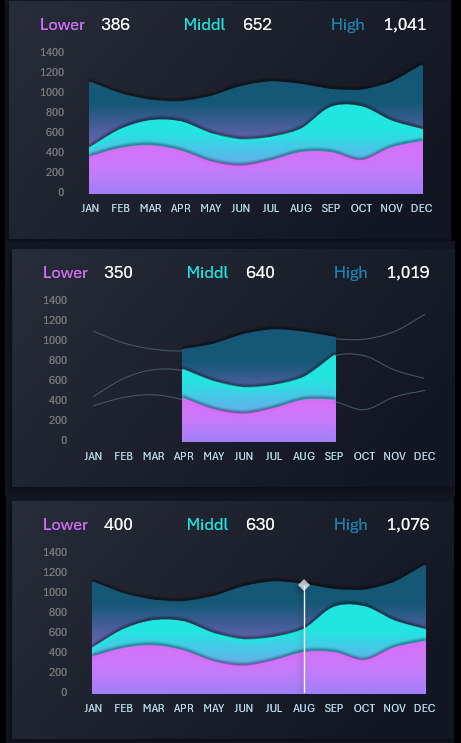
This block allows you to analyze the dynamics of price changes for three averaged levels:
- Low-level price.
- Average check.
- High-level price.
This block also has three data display modes, similar to the second "Sales" block, but does not have control elements. Therefore, it is managed using the control element in the second block in a similar way.
Dashboard Design Presentation
All the above-described blocks are harmoniously combined into a comprehensive system for visual data analysis of sales. The dashboard has interactive capabilities and elements of modern graphic design for presenting reports:
Download the dashboard for comparing niche and mass market sales in Excel 
In the next articles, we will also look at the child screens of this data visualization template, created using standard MS Excel tools.
STOCK CONTROL:
FIFO LOGISTICS: