Excel Dashboard of inventory management reports sample
Warehouse organization and inventory management are among the most important tasks in manufacturing and retail businesses. The primary issue in sales is the remaining unsold inventory. It's crucial to maintain a balance of inventory in any trade. If there's too much inventory in stock, storage costs will increase. Conversely, if there's very little or no inventory on the shelves, it indicates poorly planned supply volumes and poses the risk of missed profits.
Dashboard for Effective Warehouse Management
Effectively managing warehouse inventory means effectively managing the microeconomics of your business. It reduces costs, enhances customer service levels, and optimizes inventory when planning purchases and/or production.
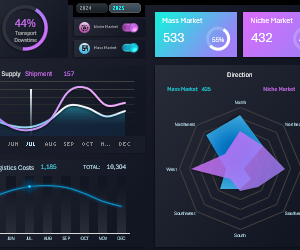
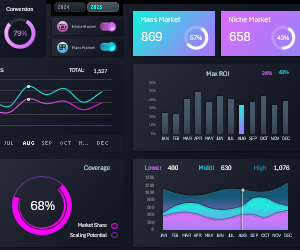
For effective warehouse management, you can use the second screen of this dashboard, named "STOCK CONTROL". Its main feature is the ability to analyze goods based on two basic categories:
- Niche Market.
- Mass Market.
Such a dashboard is particularly useful for small businesses, where these two main categories of goods are often stored in the same warehouse. By leveraging this feature, managers can make strategic decisions more quickly. All they need to do is to look at the data visualization at the beginning and end of the workday. By dedicating 20 minutes a day to the dashboard, managers gain an overview of the warehouse:
- Clearly understand the direction of the overall inventory planning strategy.
- Easily analyze the stages of sales plan influence.
- Identify shortcomings and address them quickly.
It's essential to analyze inventory in terms of niche and mass market products. They have different sales dynamics and seasonality. Different target audience of consumers. Consequently, their behavioral factors and reactions to the availability of necessary goods in required quantities or delivery times differ.
Structure of STOCK CONTROL Dashboard
This is a continuation of describing all screens of data visualization for comparative analysis of niche and mass market for small businesses in sales. Therefore, the second screen has a series of similar control elements described in the previous article:

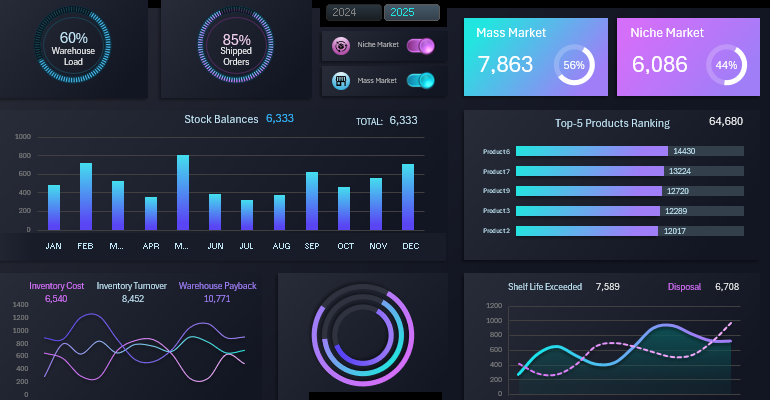
Indicators for Real-time Data Update
At the top of the dashboard, two blocks with important overall indicators for the warehouse are displayed:
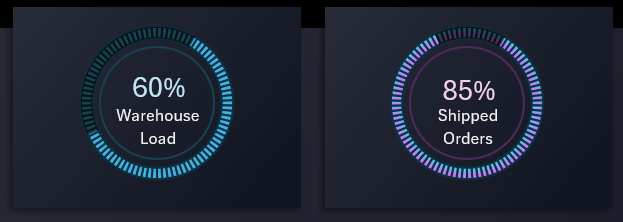
- Total warehouse loading with goods.
- Percentage of completed order requests.
It is desirable that the dashboard file has a connection to the ERP system server to update these values in real-time or when opening an Excel file. This can be easily implemented using the menu: Data → Get & Transform Data → Get Data. From the drop-down menu, choose a convenient type of data replication with the server according to the data exchange policy protocol in your company and use the dashboard online.
Warehouse Balance
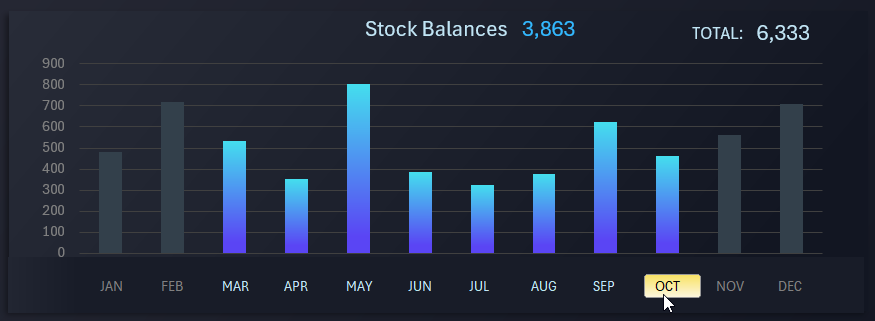
Here we track the dynamics of changes in the monthly balance of goods in the warehouse. The block contains a control element for data sampling simultaneously for several months. This filter controls all blocks on the dashboard and updates their values relative to the specified sampling criteria. For example, as seen in the following block.
Comparative Analysis of Indicators
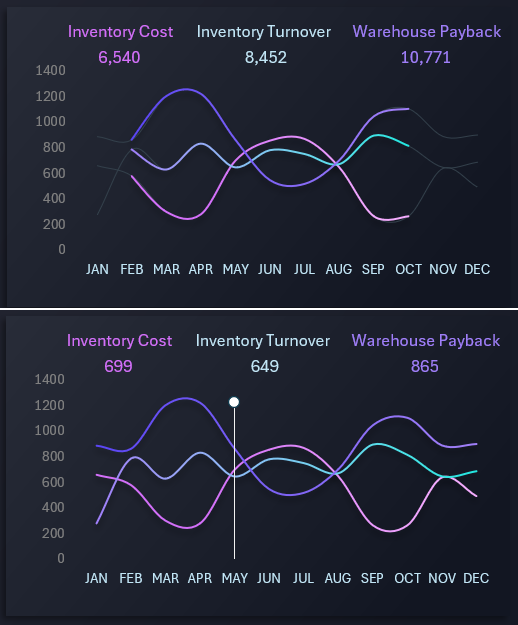
In this visualization block, we track the intersection of curves and the dynamics of changes in three indicators simultaneously:
- Cost of inventory.
- Inventory turnover.
- Warehouse profitability.
As shown above in the figure, the chart can display data visualization in two modes:
- Selection for a period of several months - curves are highlighted only within the selected range.
- Selection for 1 month - the month is highlighted with a white marker.
Data selection on the chart is controlled by a control element from the previous central block with a vertical histogram.
Warehouse Document Flow
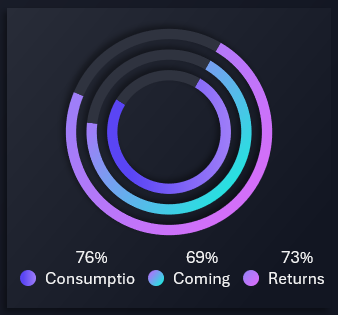
A multilayer circular diagram for representing the shares of warehouse document execution for three types:
- Expense.
- Income.
- Return.
Top 5 Most Actively Moved Goods in Warehouse Circulation
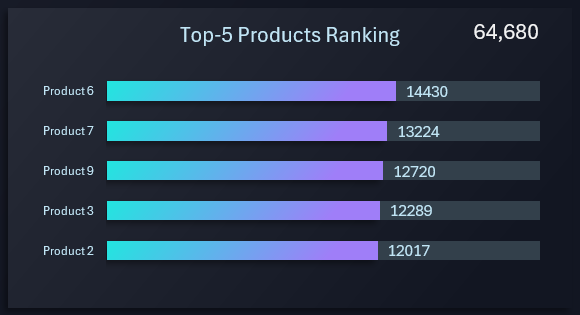
The rating automatically sorts all indicators in descending order. Instead of product names, you can use their inventory codes.
Analysis of Expired and Defective Goods with Utilization
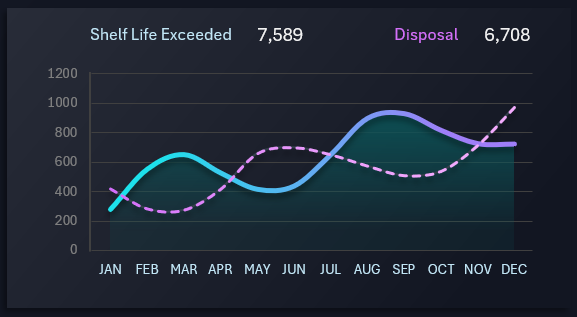
It is also important to keep track of expired and defective goods on any warehouse, as well as the dynamics of their utilization. This chart also can represent indicator values in different data sampling modes for the accounting period.
Template Dashboard for Warehouse Accounting
All blocks of data visualization about goods storage harmoniously combine into a comprehensive dashboard with interactive capabilities using Excel tools:
Download the dashboard template for warehouse accounting in Excel 
Overall, visual analysis of warehouse goods plays a significant role in efficient inventory management and ensuring business success. It helps to timely reduce costs, increase customer service levels, and quickly make informed strategic decisions.
SUMMARY REPORT:
FIFO LOGISTICS: