Download beautiful data visualization templates in Excel
Presentation-style report templates with dynamic metrics graphs. Download data visualization for spreadsheets. Lessons on creating presentations in Excel.Collection of visualizations for dashboards
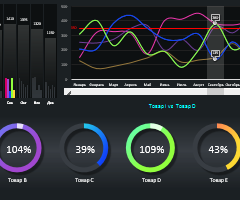
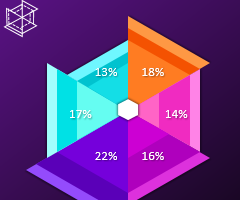 Petal Pie Сhart and benchmarking in Excel.
An example of creating and using a pie chart from a petal. Download an interactive template with data visualization on a pie chart for comparative analysis.
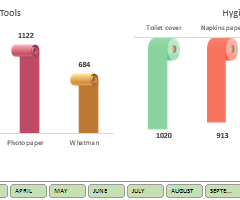 Shapes in charts and graphs for report presentation in Excel.
Download an example report presentation template with data visualization decorated with vector shapes. How to transfer a vector drawing from Adobe Illustrator to MS Excel or MS PowerPoint?
 Monthly Sales Close Plan Template on Excel Chart.
Download a report to draw up sales plans separately for several managers for a year, half year, quarter, month, week. An example of a dashboard for planning and analyzing the effectiveness of a sales department.
 Excel Sales Report Template on monthly and daily Chart.
An example of using shapes with vector graphics drawn in PowerPoint for an interactive report on a comparative analysis of the implementation of a sales plan.
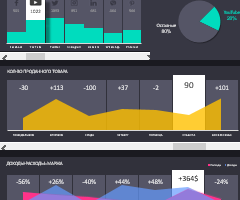
 Advanced sales comparative analysis products download in Excel.
A working example of a turnkey solution for performing advanced sales benchmarking with data visualization and interactive report controls.
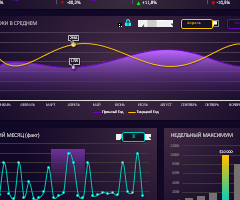
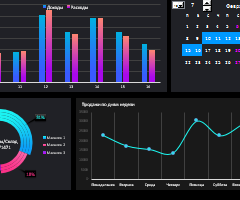
 Metro style dashboard design for charts in Excel.
An example of a stylish dashboard with a metro design for the design of charts and graphs for a beautiful visualization of the data of the report on weekly sales of the online store.
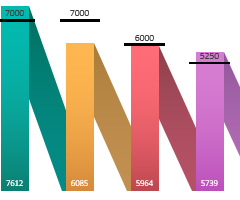
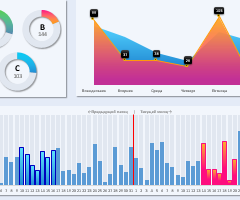
 Benchmark sales by year on a dashboard report in Excel.
An example of an interactive report in the form of a dashboard for performing a visual comparative analysis of sales for the current and previous year.
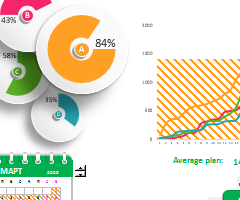
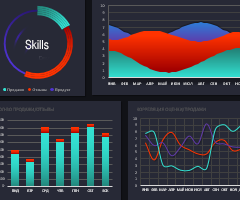 Dashboard for visual analysis of test results in Excel.
An example of a dashboard template with a consolidated analytical report on testing the effectiveness of skills of top managers of the sales department, free download.
 How to make an interactive calendar in Excel template download.
Download the template with an interactive calendar without using macros. An example of data visualization for sampling time periods by calendar dates.
 Benchmarking sales with data visualization in Excel.
An interesting method of comparative analysis of sales using the capabilities of interactive data visualization. How to compare 2 periods on the same chart?
