Download examples of using formulas and functions in Excel
Ready samples of electrical spreadsheet abilities in the economic and financial breakdown of companies.Spreadsheet capabilities
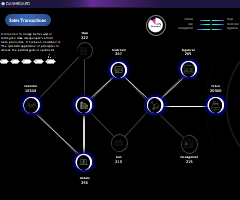 Payment Processing Transactions Scheme New Chart in Excel.
Download a sample template for a new homemade Excel chart type with data visualization animations and interactive features for narrowly focused tasks.
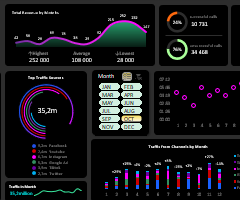 Excel Comparative and Correlation analysis of sales download.
Download a dashboard for comparative and correlation analysis of marketing and sales results. How do you friend marketing and sales with an Excel report?
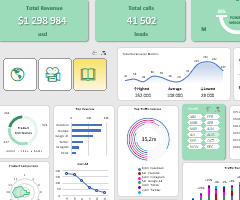 Analysis Sale of learning Courses Excel Dashboard Download.
Download dashboard for correlation analysis sales training course development data visualization in Excel. Interactive report presentation.
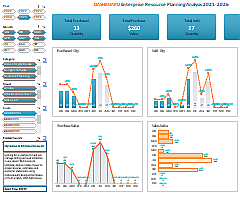 Financial analytics IT business for enterprise sales in Excel.
Download a data visualization example for financial sales analysis with extensive features: segmentation, filtering, sampling and value searching.
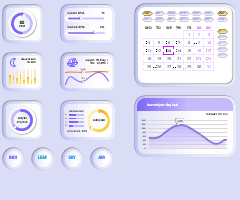 Fitness calendar with weather analysis download template in Excel.
Dashboard with visualization of data about the weather and the physical condition of the user. A project of a fitness application for analyzing the correlation of weather and body condition indicators during physical exertion during training.
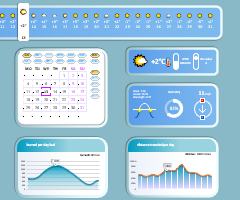 Weather analysis and fitness calendar download in Excel.
Download a weather and fitness calendar dashboard to analyze the correlation of your performance and adjust your values to improve your exercise performance. The effect of weather conditions on the body during exercise.
 Dashboard for gadget store sales report download in Excel.
Download a dashboard for a gadget store. Sales report presentation template with data visualization to analyze the return on investment invested in the business.
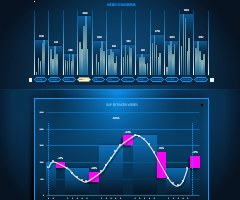 Gap Analysis template Excel with Chart free download.
Strategic Gap Analysis in Financial Performance Statistics. Interactive data visualization with design elements for practical applications.
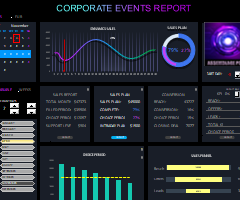 Corporate events and execution of KPI plans in Excel.
An example of the data visualization for the report presentation and visual analysis of the correlation between the implementation of corporate events and the fulfillment of plans by key performance indicators (KPIs).
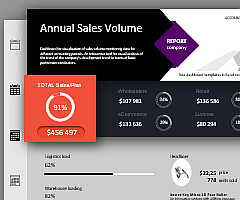
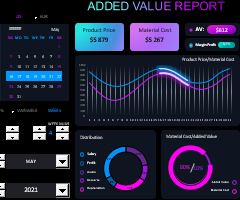 Added value excel dashboard example free download.
Download interactive presentation of enterprise value added financial measures. What is value added best example report.
