Download examples of ready-made templates for interactive reports in Excel
Ready-made solutions and examples for creating interactive documents or reports with formulas and functions for calculating input values.Download document and report templates
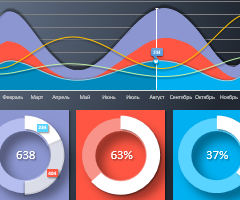 Chart report on financial results of company download in Excel.
Download an example of creating an interactive graphical report for analyzing indicators of the financial results of the company for the accounting period.
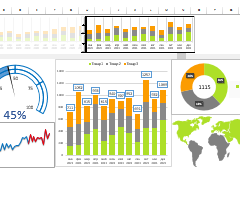
 Simple DASHBOARD template in Excel without VBA-macros.
Download an example of a simple but interactive and stylish dashboard template with data visualization without using VBA macros or third-party add-ons.
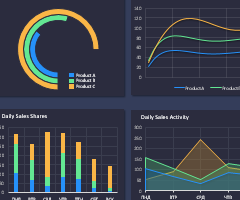
 Dashboard and visual report Designer download in Excel.
Dashboard constructor with data visualization, allows you to design reports in Excel from a library of 13 diagrams and graphs in a few clicks of the mouse.
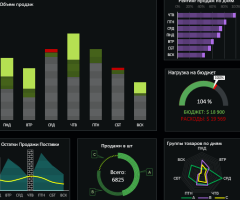
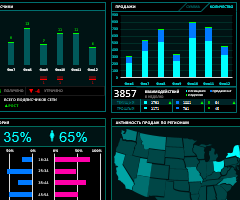
 Stylish green dashboard for advertising download in Excel.
An example of a stylish visualization of metrics for advertising traffic for online trading. Green dashboard for business free download.
 3D menu for dashboard analysis with data visualization in Excel.
A beautiful example of the use of elements of interactive gamification with animation and visualization for boring dashboards with consolidated sales reports.
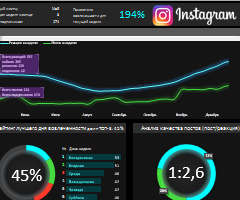 How to make dashboard reports for Instagram metrics in Excel.
A practical example of using a dashboard to work on Instagram with SMM indicators of marketing promotion. What is the advantage of data visualization over precise mathematical calculations?
 Dashboard for analyzing of advertising and sales in Excel.
An example of data visualization on statistical indicators of the use of advertising budgets with subsequent conversion to sales on different charts.
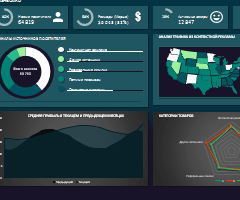
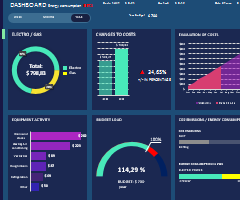 Energy reporting dashboard free download example in Excel.
An example of a free dashboard for data visualization, followed by an analysis of indicators of energy costs of a manufacturing enterprise.
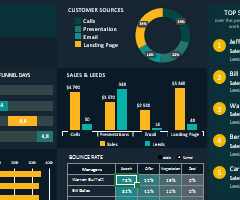 Dashboard of sales funnel conversion in Excel free download.
An example of how to dynamically visualize tobacco data and analyze the conversion of attracted customers to all stages of funnel sales.
 Dashboard report quantity of products sold download in Excel.
An example of a dashboard-style report for visual analysis of statistical data on the monthly sales of three groups of goods in the number of pieces over three years - download.
