How to Harness the Power of Formulas in Excel Examples
Master the Excel Formula Magic! Unleash the power of data manipulation with essential formula techniques. Boost your productivity and analytical skills.
Excel Formulas for Beginners
 How to Compare Two Lists or Tables Using a Formula in Excel.
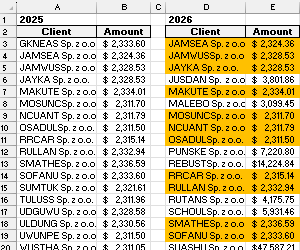
The fastest way to compare values from two lists of different sizes is by using conditional formatting with a formula. Download the template with comparison formulas for two lists in Excel.
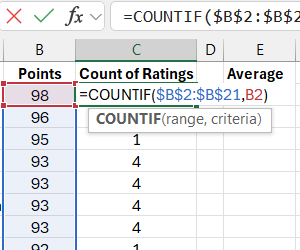
 Examples of Formulas for Calculating Frequency in Excel.
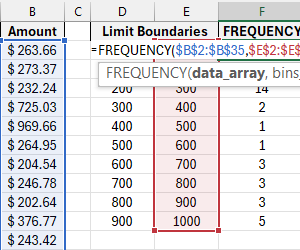
Calculating the frequency of the most commonly occurring values in a dataset. How to create a formula for the FREQUENCY and COUNTIFS functions? Download examples of using the FREQUENCY formula in Excel.
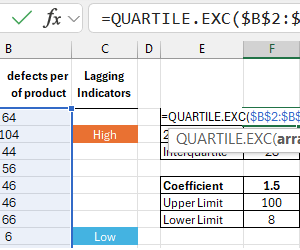
 Formula for get Statistical Outliers with Sampling in Excel.
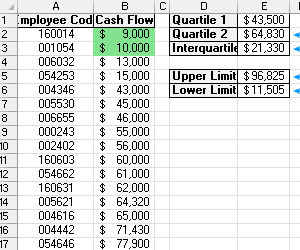
Examples of quartile-based formulas for identifying and calculating statistical outliers for subsequent removal or analysis in Excel. Download a template with calculations and conditional formatting.
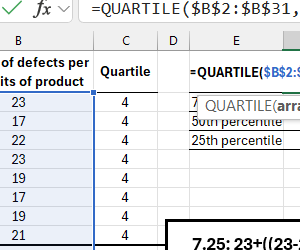
 How to Calculate Percentile Using Formula in Excel.
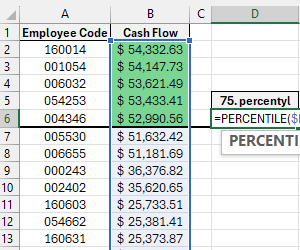
This example shows how to calculate percentiles for different data groups and apply multiple conditional formatting rules to divide a cell range into percentile groups in Excel.
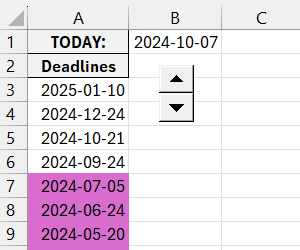 Example Formula for Highlighting Overdue Dates in Excel.
Create a formula for conditional formatting to automatically highlight overdue dates in Excel. Easily track deadline dates using this feature in MS Excel.
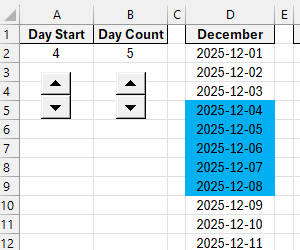 Example Formula for Highlighting Dates by Period in Excel.
Automatic color highlighting of a list of dates for a specific time period using conditional formatting with a formula. An interactive template for highlighting date ranges by color in Excel.
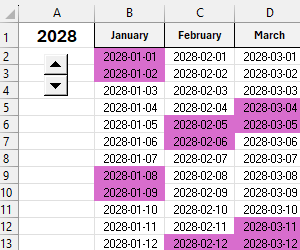 Example Formula for Highlighting Weekends by Date in Excel.
Automatically highlighting only weekend dates in a list using conditional formatting with a formula involving the WEEKDAY function in Microsoft Excel.
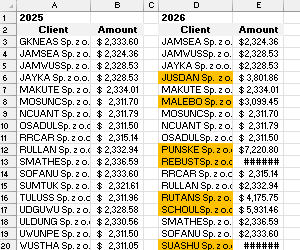 Formula for Comparing Two Tables by Condition in Excel.
This is an example of using a formula to compare the values of two different tables by condition using conditional formatting rules. How can you dynamically compare the contents of two tables in Excel?
 Formula for Automatic Formatting Based on Value in Excel.
This is an example of creating a formula for dynamically changing cell formats based on the value in a reference cell. How to apply conditional formatting to a range of cells in Excel?
 Example of Using a Formula in Excel Conditional Formatting.
How to use formulas for conditional formatting of cell ranges. How to apply dynamic formatting based on conditions in an Excel table - Download Example.
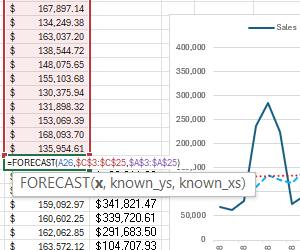 FORECAST Excel Formula for Sales Prediction with Seasonality.
Examples of formulas for creating a forecast table used for analysis and sales predictions for the upcoming year, taking seasonality into account. Download the template for sales forecast analysis with seasonality in Excel.
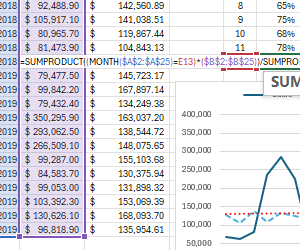 Example of a Formula for Sales Deseasonalization in Excel.
Example formulas for calculating sales deseasonalization based on historical data. Formula for calculating the sales seasonality coefficient. Download a sales deseasonalization analysis template in Excel.
 Interquartile Range in Excel with QUARTILE Formula Example.
Example formula for calculating the interquartile range in statistical analysis of datasets. How to use the QUARTILE function in the interquartile range? Download example formulas in Excel.
 Examples of Formulas for Calculating Quartiles in Excel.
Working with formulas to calculate quartiles based on percentiles. Examples of using new QUARTILE.EXC and MATCH formulas. Download example formulas in Excel format.
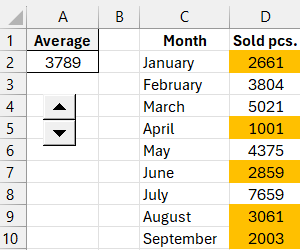
 Excel Formulas for get Average with MEDIAN or MODE Functions.
Examples of formulas for different methods of finding and calculating averages. Examples of calculating the median and mode for the most frequent or repeating values in Excel.
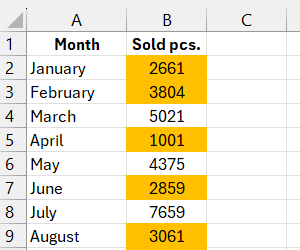
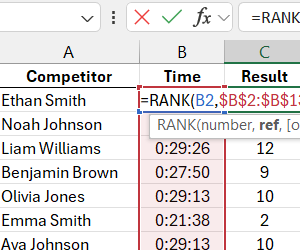 Formula for Extracting Multiple Largest Values in Excel.
This example demonstrates how to extract multiple largest and smallest values using formulas. How to rank numerical values using the RANK and RANK.AVG functions in Excel?
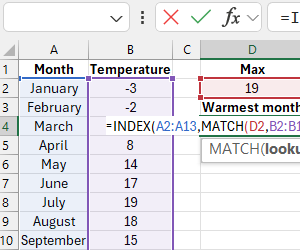 Formula for Finding Maximum or Minimum Values in Excel.
Example of how to sample maximum and minimum statistical values using formulas. How to work with the MAX, MIN, INDEX, and MATCH functions? How to search by minimum negative value in an Excel table?
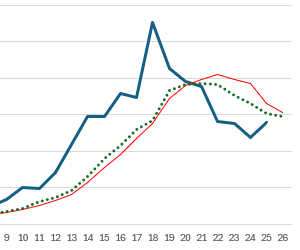 Exponential Smoothing Method for Moving Average in Excel.
Example of value smoothing using the moving average method. How to build a moving average line on a statistics graph in MS Excel. Formula for Calculating Exponential Smoothing.
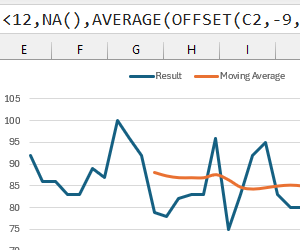 Data Smoothing Formula Using Moving Average Method in Excel.
Example of smoothing values using the moving average method. How to build a moving average line on a statistics Chart in Excel. Formula uses several Excel functions OFFSET.
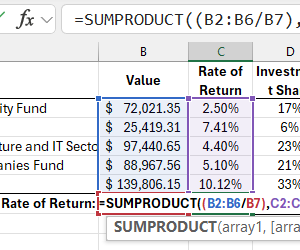 Excel Formula for Weighted Average Interest Rate of Portfolio.
Example formulas for calculating the weighted average return rate of an investment portfolio. How to calculate the weighted average interest rate step-by-step using the SUMPRODUCT formula in Excel?

Data Visualization Charts for Interactive Report Creation in Excel.
Dashboard Templates